Publication
Metrics
AI Quick Summary
This paper investigates the reliability of the Sharpe ratio in distinguishing asset manager skill from luck. It proposes statistical tests to measure the quality of Sharpe ratios, assessing whether high ratios reflect skill or statistical estimation errors, and provides reference tables for determining the minimum required Sharpe ratio for statistical significance given different time periods and auto-correlation levels.
Paper Preview
Abstract
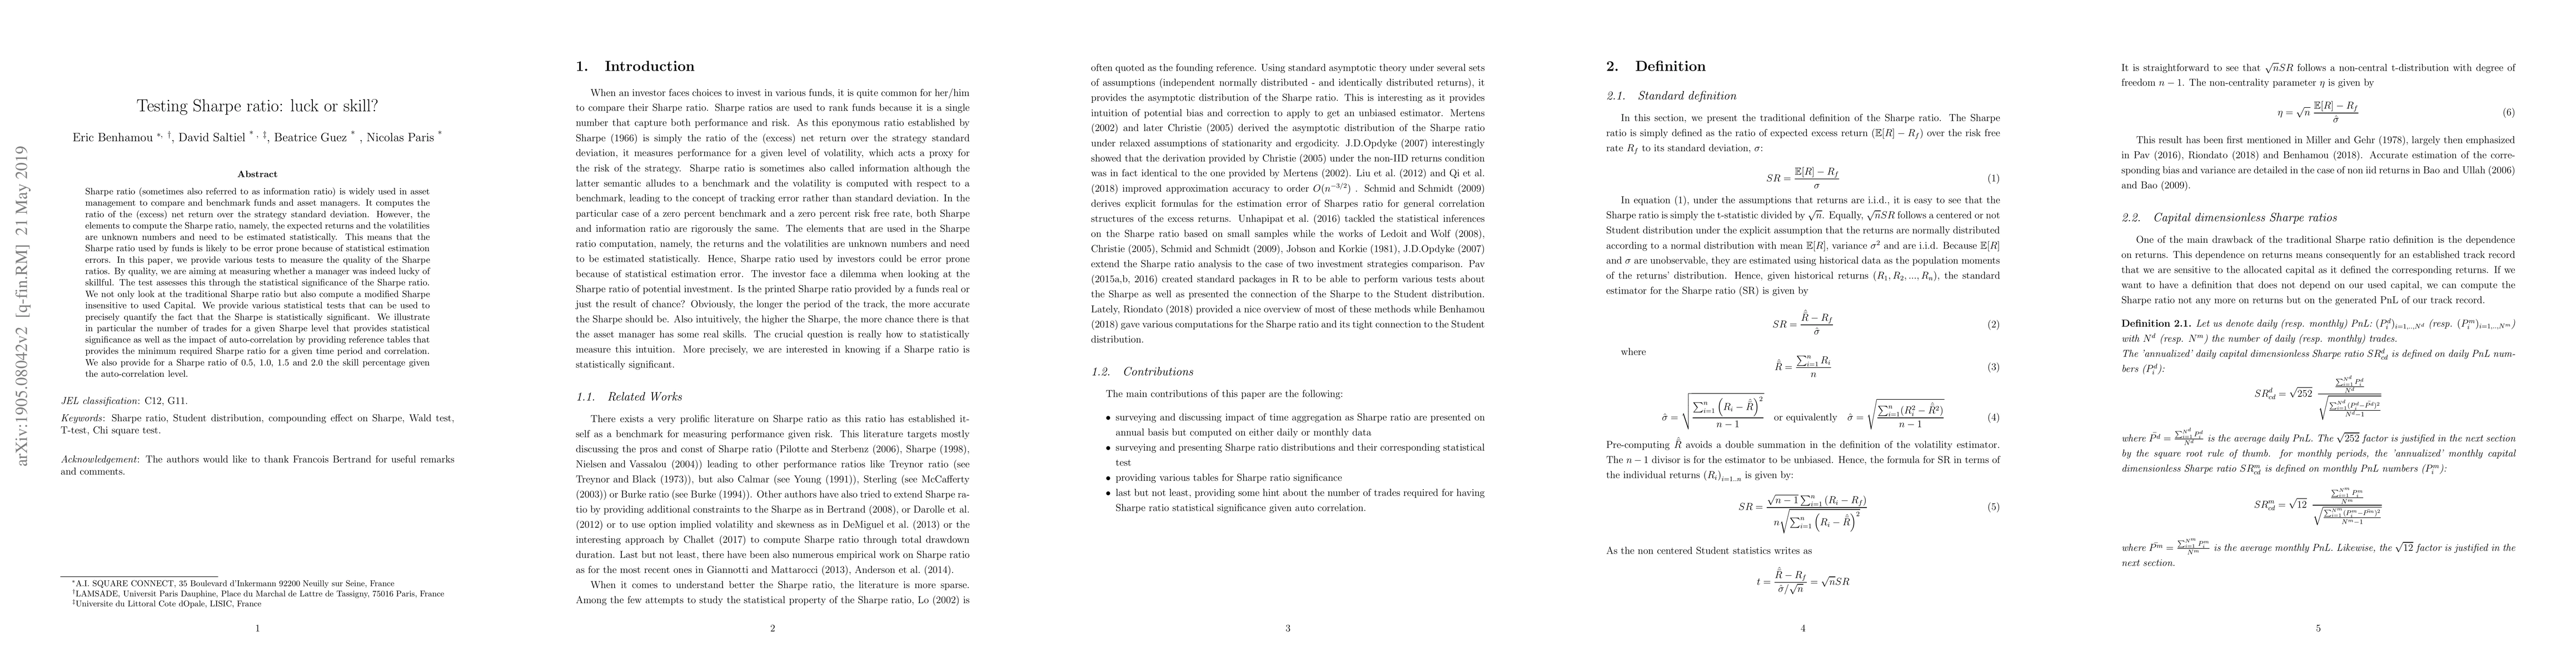
Sharpe ratio (sometimes also referred to as information ratio) is widely used in asset management to compare and benchmark funds and asset managers. It computes the ratio of the (excess) net return over the strategy standard deviation. However, the elements to compute the Sharpe ratio, namely, the expected returns and the volatilities are unknown numbers and need to be estimated statistically. This means that the Sharpe ratio used by funds is likely to be error prone because of statistical estimation errors. In this paper, we provide various tests to measure the quality of the Sharpe ratios. By quality, we are aiming at measuring whether a manager was indeed lucky of skillful. The test assesses this through the statistical significance of the Sharpe ratio. We not only look at the traditional Sharpe ratio but also compute a modified Sharpe insensitive to used Capital. We provide various statistical tests that can be used to precisely quantify the fact that the Sharpe is statistically significant. We illustrate in particular the number of trades for a given Sharpe level that provides statistical significance as well as the impact of auto-correlation by providing reference tables that provides the minimum required Sharpe ratio for a given time period and correlation. We also provide for a Sharpe ratio of 0.5, 1.0, 1.5 and 2.0 the skill percentage given the auto-correlation level.
AI Key Findings
Get AI-generated insights about this paper's methodology, results, significance, and more — seven facets brought into focus.
Impact
Paper Details
PDF Preview
Key Terms
Citation Network
Current paper (gray), citations (green), references (blue)
Display is limited for performance on very large graphs.
Discussion 0