Summary
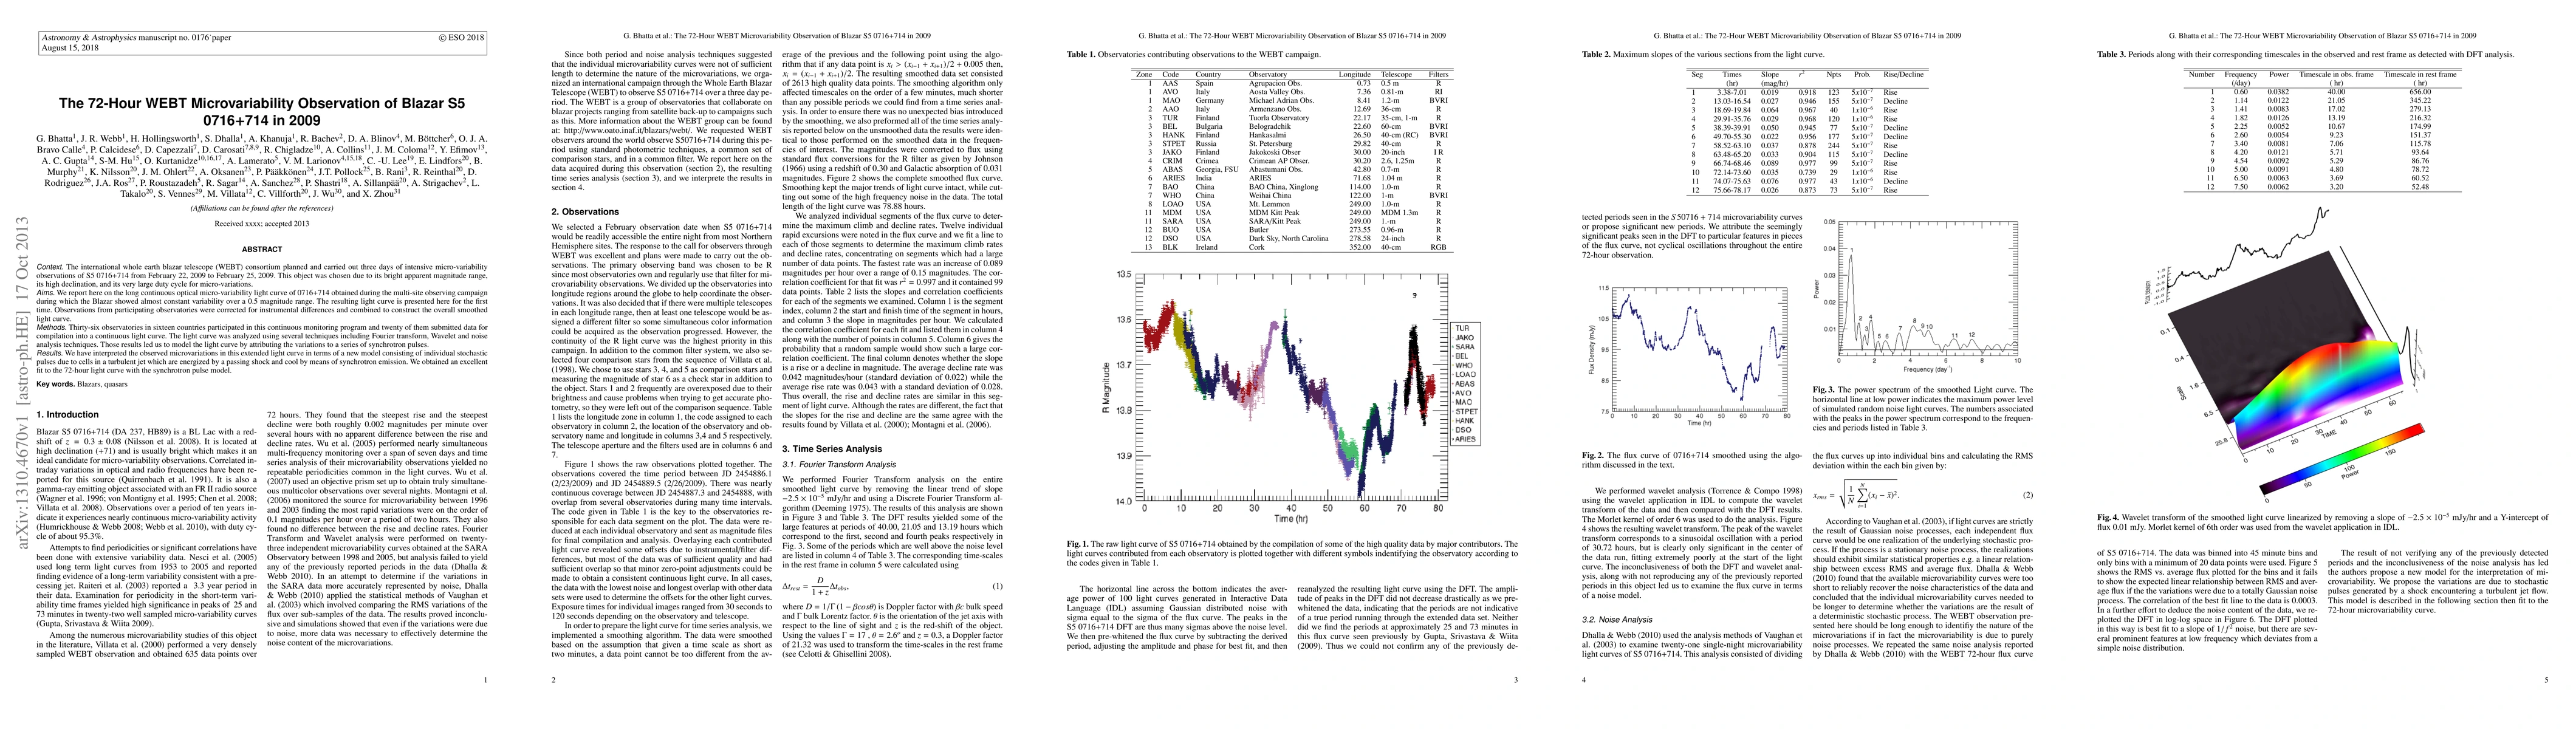
Context. The international whole earth blazar telescope (WEBT) consortium planned and carried out three days of intensive micro-variability observations of S5 0716+714 from February 22, 2009 to February 25, 2009. This object was chosen due to its bright apparent magnitude range, its high declination, and its very large duty cycle for micro-variations. Aims. We report here on the long continuous optical micro-variability light curve of 0716+714 obtained during the multi-site observing campaign during which the Blazar showed almost constant variability over a 0.5 magnitude range. The resulting light curve is presented here for the first time. Observations from participating observatories were corrected for instrumental differences and combined to construct the overall smoothed light curve. Methods. Thirty-six observatories in sixteen countries participated in this continuous monitoring program and twenty of them submitted data for compilation into a continuous light curve. The light curve was analyzed using several techniques including Fourier transform, Wavelet and noise analysis techniques. Those results led us to model the light curve by attributing the variations to a series of synchrotron pulses. Results. We have interpreted the observed microvariations in this extended light curve in terms of a new model consisting of individual stochastic pulses due to cells in a turbulent jet which are energized by a passing shock and cool by means of synchrotron emission. We obtained an excellent fit to the 72-hour light curve with the synchrotron pulse model.
AI Key Findings
Get AI-generated insights about this paper's methodology, results, and significance.
Paper Details
PDF Preview
Key Terms
Citation Network
Current paper (gray), citations (green), references (blue)
Display is limited for performance on very large graphs.
Similar Papers
Found 4 papers| Title | Authors | Year | Actions |
|---|
Comments (0)