Authors
Summary
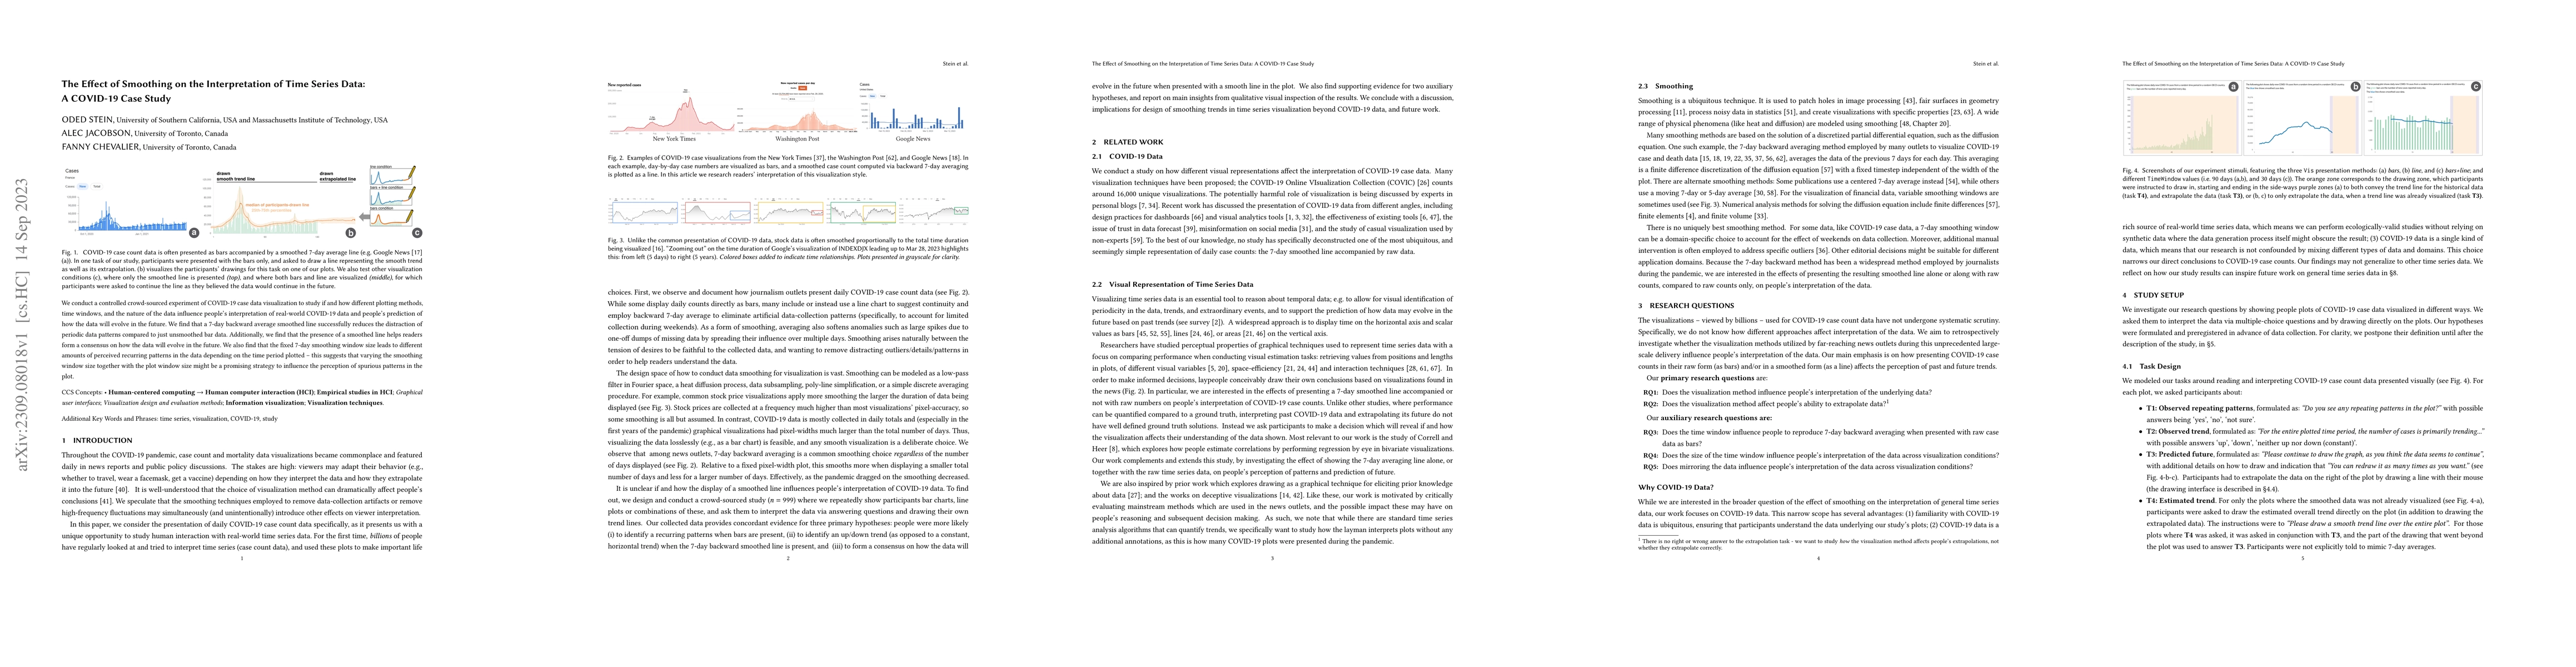
We conduct a controlled crowd-sourced experiment of COVID-19 case data visualization to study if and how different plotting methods, time windows, and the nature of the data influence people's interpretation of real-world COVID-19 data and people's prediction of how the data will evolve in the future. We find that a 7-day backward average smoothed line successfully reduces the distraction of periodic data patterns compared to just unsmoothed bar data. Additionally, we find that the presence of a smoothed line helps readers form a consensus on how the data will evolve in the future. We also find that the fixed 7-day smoothing window size leads to different amounts of perceived recurring patterns in the data depending on the time period plotted -- this suggests that varying the smoothing window size together with the plot window size might be a promising strategy to influence the perception of spurious patterns in the plot.
AI Key Findings
Get AI-generated insights about this paper's methodology, results, and significance.
Paper Details
PDF Preview
Key Terms
Citation Network
Current paper (gray), citations (green), references (blue)
Display is limited for performance on very large graphs.
Similar Papers
Found 4 papersCOVID-19 incidence in the Republic of Ireland: A case study for network-based time series models
Gesine Reinert, Stephanie Armbruster
Feature-weighted Stacking for Nonseasonal Time Series Forecasts: A Case Study of the COVID-19 Epidemic Curves
Terence L. van Zyl, Pieter Cawood
No citations found for this paper.
Comments (0)