The Frustrometer: Detecting User Frustration in Data Visualization Tasks using Biomarkers and Interaction Patterns
Publication
Metrics
Paper Preview
Abstract
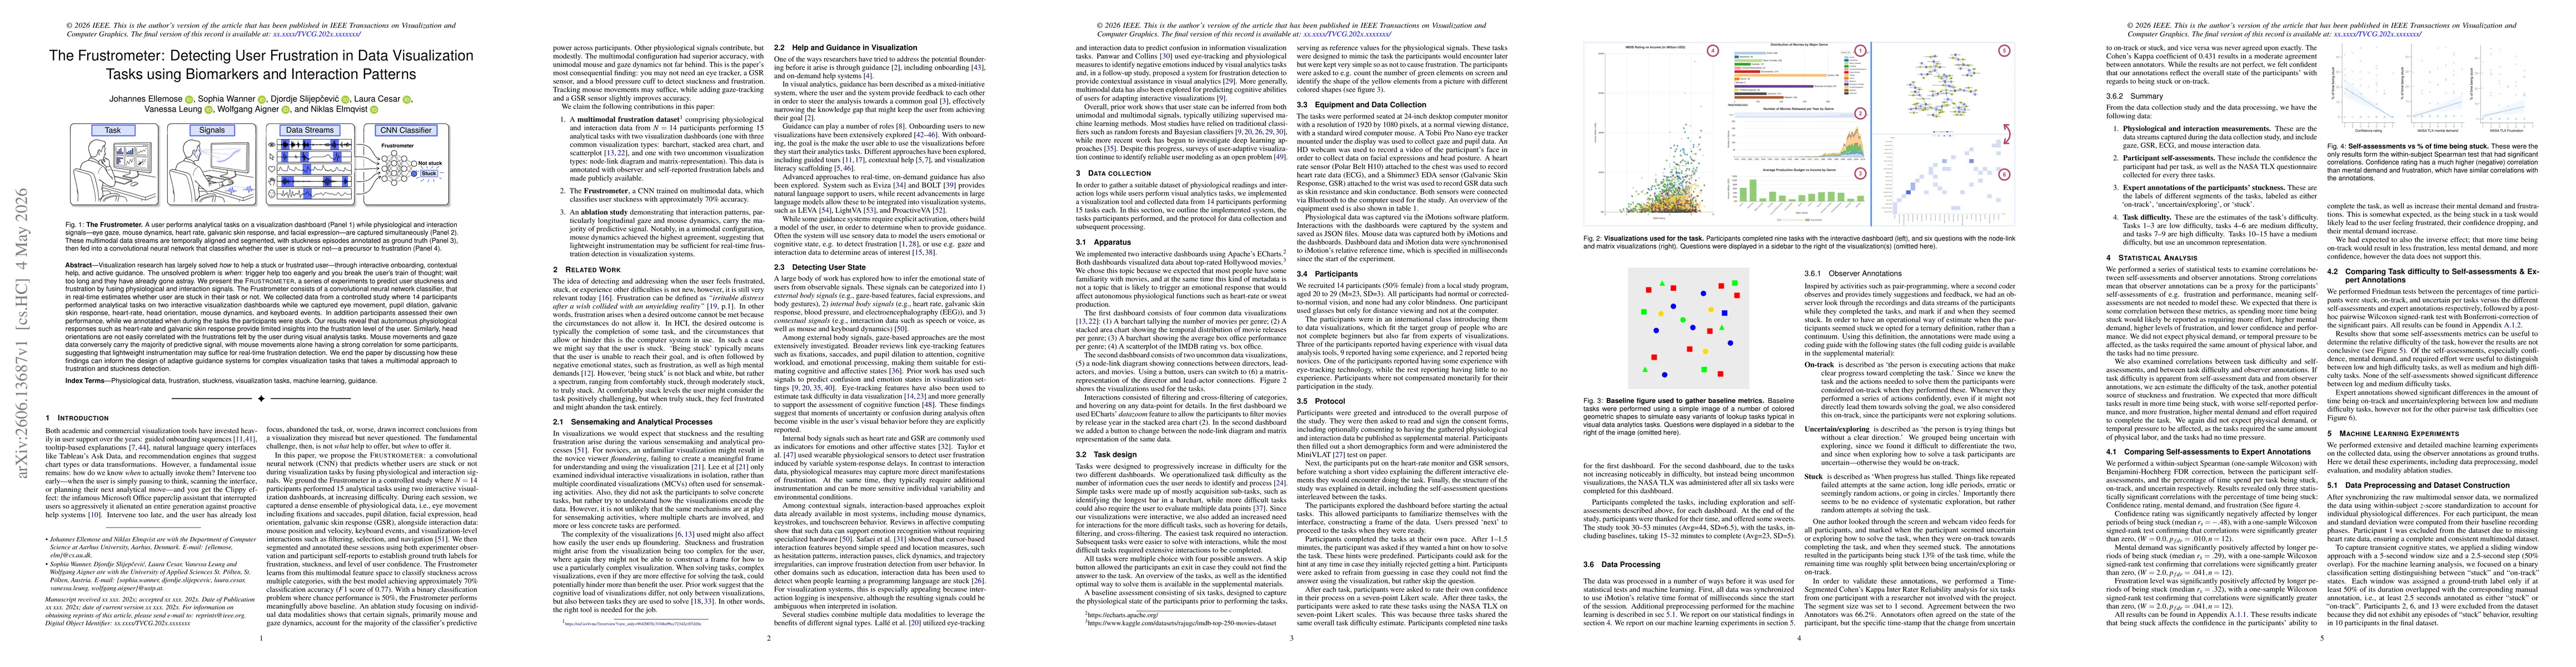
Visualization research has largely solved \textit{how} to help a stuck or frustrated user -- through interactive onboarding, contextual help, and active guidance. The unsolved problem is \textit{when}: trigger help too eagerly and you break the user's train of thought; wait too long and they have already gone astray. We present the \textsc{Frustrometer}, a series of experiments to predict user stuckness and frustration by fusing physiological and interaction signals. The Frustrometer consists of a convolutional neural network classifier, that in real-time estimates whether user are stuck in their task or not. We collected data from a controlled study where 14 participants performed analytical tasks on two interactive visualization dashboards while we captured eye movement, pupil dilation, galvanic skin response, heart-rate, head orientation, mouse dynamics, and keyboard events. In addition participants assessed their own performance, while we annotated when during the tasks the participants were stuck. Our results reveal that autonomous physiological responses such as heart-rate and galvanic skin response provide limited insights into the frustration level of the user. Similarly, head orientations are not easily correlated with the frustrations felt by the user during visual analysis tasks. Mouse movements and gaze data conversely carry the majority of predictive signal, with mouse movements alone having a strong correlation for some participants, suggesting that lightweight instrumentation may suffice for real-time frustration detection. We end the paper by discussing how these findings can inform the design of adaptive guidance systems for complex visualization tasks that takes a multimodal approach to frustration and stuckness detection.
AI Key Findings
Get AI-generated insights about this paper's methodology, results, significance, and more — seven facets brought into focus.
Discussion 0