The fundamental diagram of urbanization
Publication
Metrics
Paper Preview
Abstract
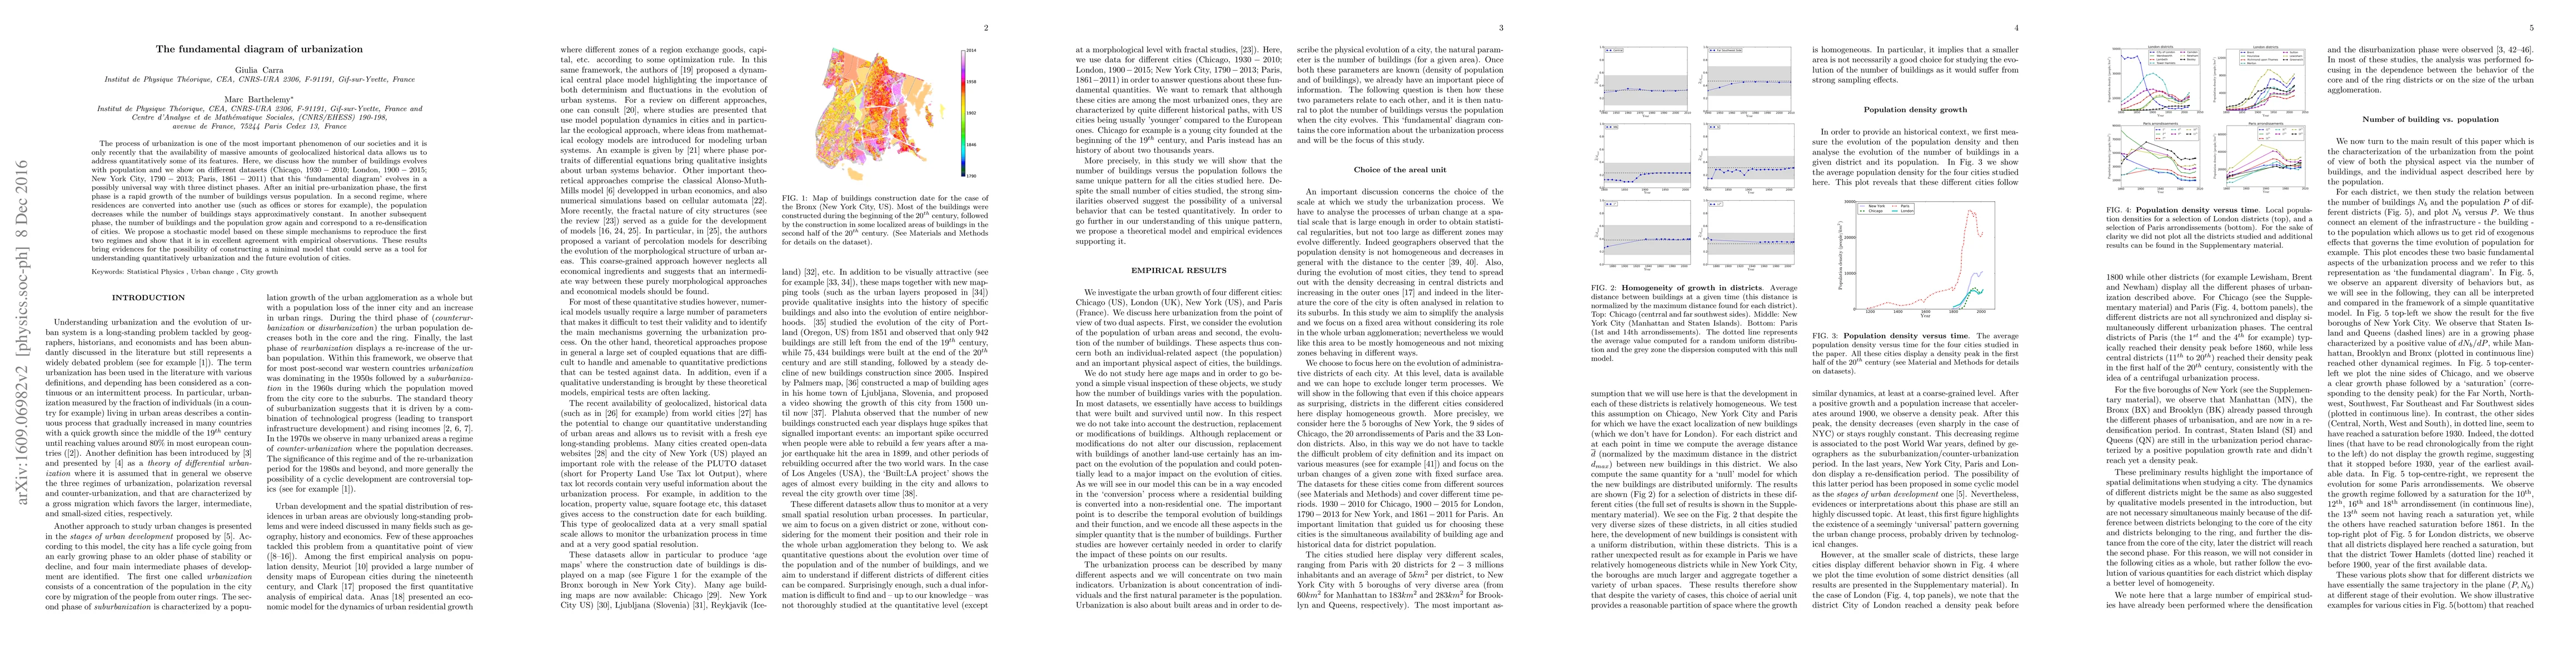
The process of urbanization is one of the most important phenomenon of our societies and it is only recently that the availability of massive amounts of geolocalized historical data allows us to address quantitatively some of its features. Here, we discuss how the number of buildings evolves with population and we show on different datasets (Chicago, $1930-2010$; London, $1900-2015$; New York City, $1790-2013$; Paris, $1861-2011$) that this `fundamental diagram' evolves in a possibly universal way with three distinct phases. After an initial pre-urbanization phase, the first phase is a rapid growth of the number of buildings versus population. In a second regime, where residences are converted into another use (such as offices or stores for example), the population decreases while the number of buildings stays approximatively constant. In another subsequent phase, the number of buildings and the population grow again and correspond to a re-densification of cities. We propose a stochastic model based on these simple mechanisms to reproduce the first two regimes and show that it is in excellent agreement with empirical observations. These results bring evidences for the possibility of constructing a minimal model that could serve as a tool for understanding quantitatively urbanization and the future evolution of cities.
AI Key Findings
Get AI-generated insights about this paper's methodology, results, significance, and more — seven facets brought into focus.
Impact
Paper Details
PDF Preview
Key Terms
Citation Network
Current paper (gray), citations (green), references (blue)
Display is limited for performance on very large graphs.
Discussion 0