The GNAR-edge model: A network autoregressive model for networks with time-varying edge weights
Publication
Metrics
AI Quick Summary
The GNAR-edge model is a network autoregressive approach for analyzing time series data with time-varying edge weights, leveraging underlying network structures for improved forecasting. The model shows effective fitting and predictive performance on real industry-to-industry transaction data, especially when the network is sparsified using lead-lag analysis.
Paper Preview
Abstract
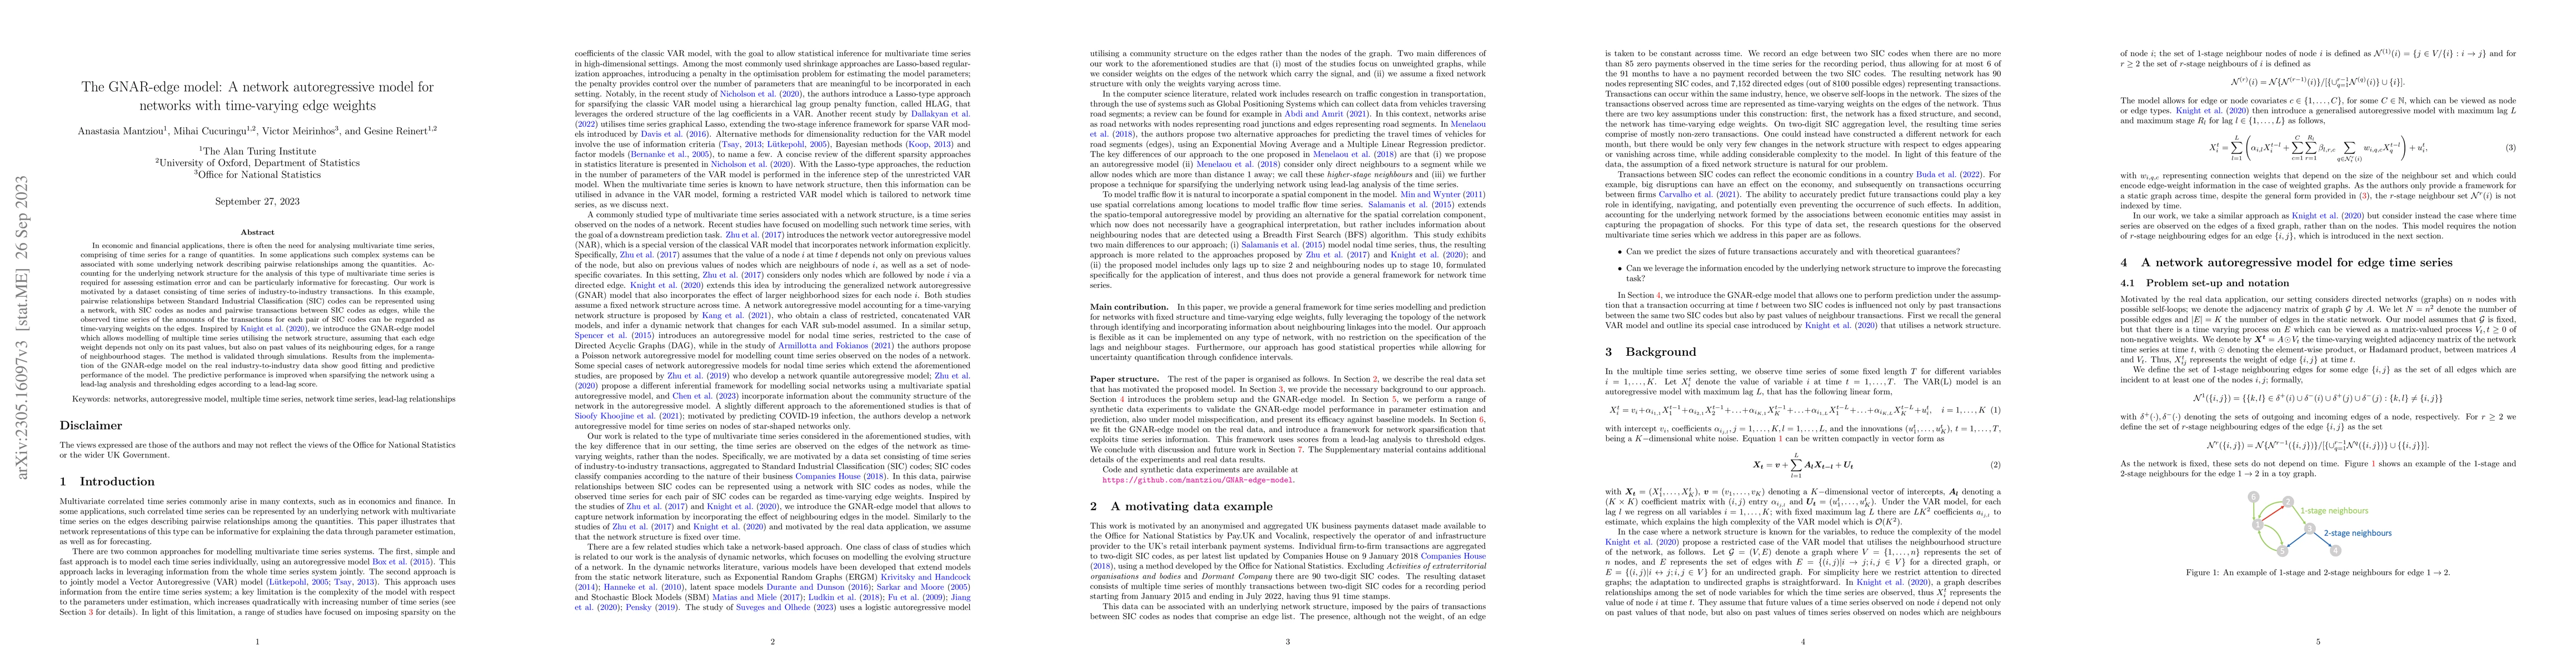
In economic and financial applications, there is often the need for analysing multivariate time series, comprising of time series for a range of quantities. In some applications such complex systems can be associated with some underlying network describing pairwise relationships among the quantities. Accounting for the underlying network structure for the analysis of this type of multivariate time series is required for assessing estimation error and can be particularly informative for forecasting. Our work is motivated by a dataset consisting of time series of industry-to-industry transactions. In this example, pairwise relationships between Standard Industrial Classification (SIC) codes can be represented using a network, with SIC codes as nodes and pairwise transactions between SIC codes as edges, while the observed time series of the amounts of the transactions for each pair of SIC codes can be regarded as time-varying weights on the edges. Inspired by Knight et al. (2020), we introduce the GNAR-edge model which allows modelling of multiple time series utilising the network structure, assuming that each edge weight depends not only on its past values, but also on past values of its neighbouring edges, for a range of neighbourhood stages. The method is validated through simulations. Results from the implementation of the GNAR-edge model on the real industry-to-industry data show good fitting and predictive performance of the model. The predictive performance is improved when sparsifying the network using a lead-lag analysis and thresholding edges according to a lead-lag score.
AI Key Findings
Get AI-generated insights about this paper's methodology, results, significance, and more — seven facets brought into focus.
Impact
Paper Details
Authors
PDF Preview
Key Terms
Citation Network
Current paper (gray), citations (green), references (blue)
Display is limited for performance on very large graphs.
Discussion 0