Authors
Summary
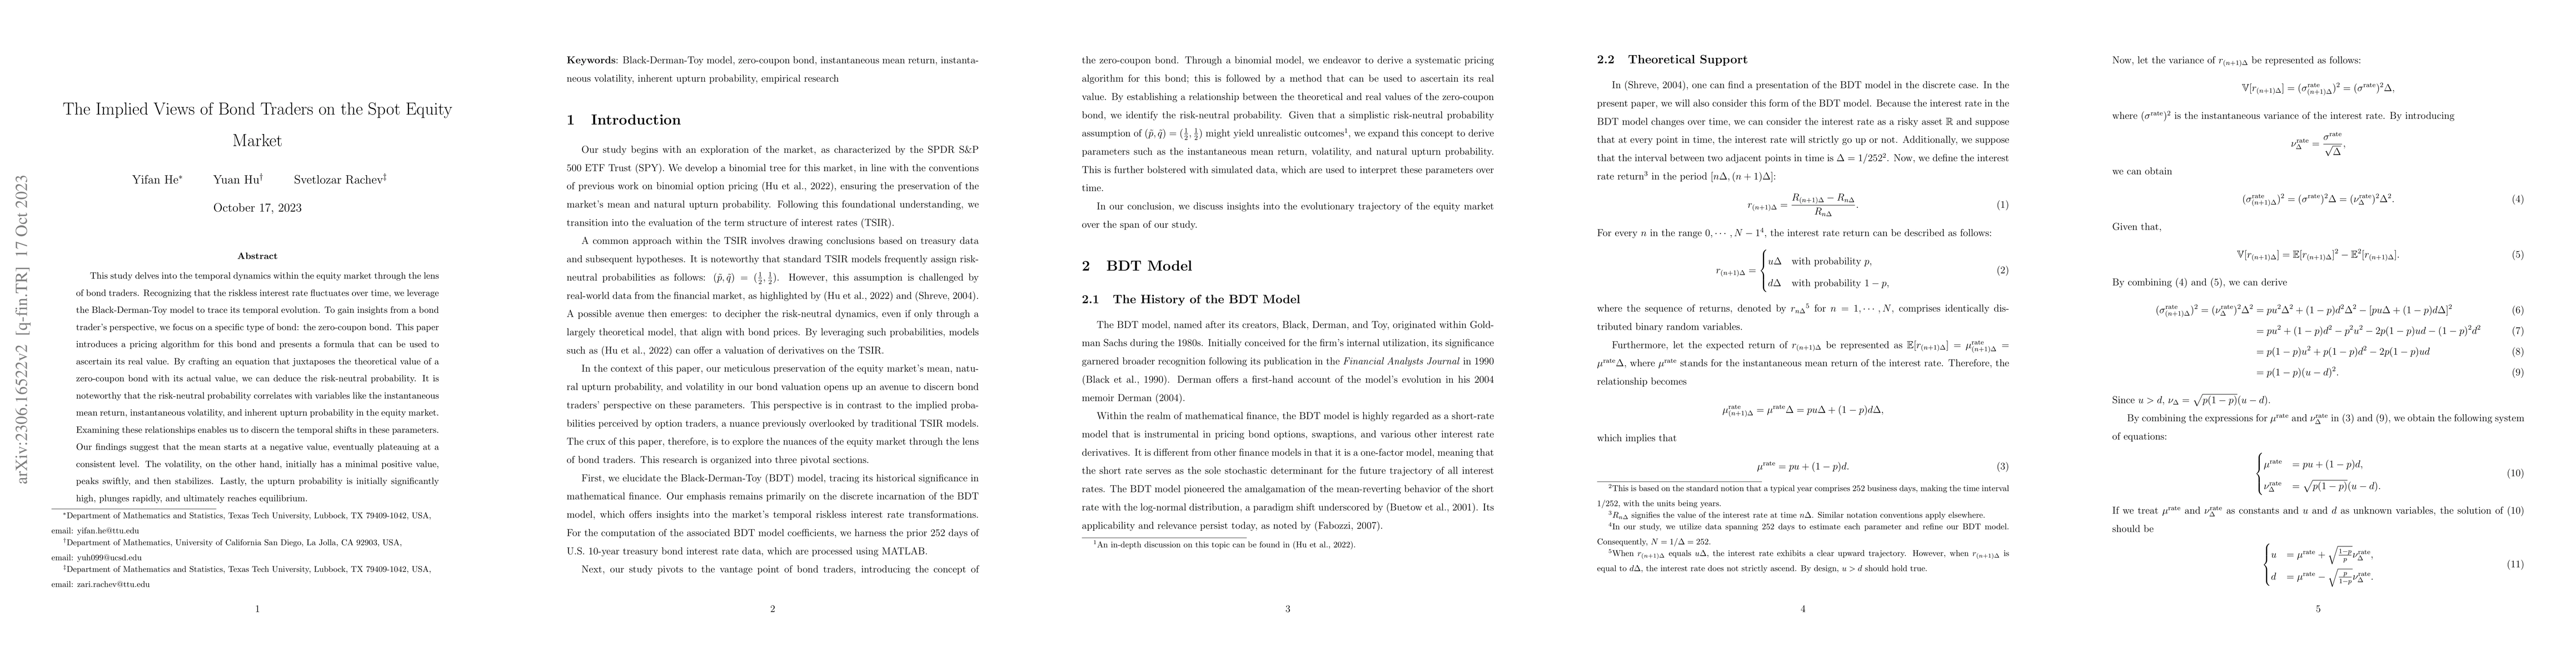
This study delves into the temporal dynamics within the equity market through the lens of bond traders. Recognizing that the riskless interest rate fluctuates over time, we leverage the Black-Derman-Toy model to trace its temporal evolution. To gain insights from a bond trader's perspective, we focus on a specific type of bond: the zero-coupon bond. This paper introduces a pricing algorithm for this bond and presents a formula that can be used to ascertain its real value. By crafting an equation that juxtaposes the theoretical value of a zero-coupon bond with its actual value, we can deduce the risk-neutral probability. It is noteworthy that the risk-neutral probability correlates with variables like the instantaneous mean return, instantaneous volatility, and inherent upturn probability in the equity market. Examining these relationships enables us to discern the temporal shifts in these parameters. Our findings suggest that the mean starts at a negative value, eventually plateauing at a consistent level. The volatility, on the other hand, initially has a minimal positive value, peaks swiftly, and then stabilizes. Lastly, the upturn probability is initially significantly high, plunges rapidly, and ultimately reaches equilibrium.
AI Key Findings
Get AI-generated insights about this paper's methodology, results, and significance.
Paper Details
PDF Preview
Key Terms
Citation Network
Current paper (gray), citations (green), references (blue)
Display is limited for performance on very large graphs.
Similar Papers
Found 4 papersNo citations found for this paper.
Comments (0)