Publication
Metrics
AI Quick Summary
The paper introduces the kernelized Taylor diagram, an advanced visualization tool that overcomes the limitations of the traditional Taylor diagram by capturing non-linear relationships and reducing sensitivity to outliers, using kernel methods and maximum mean discrepancy. This new framework is expected to enhance data population similarity analysis.
Paper Preview
Abstract
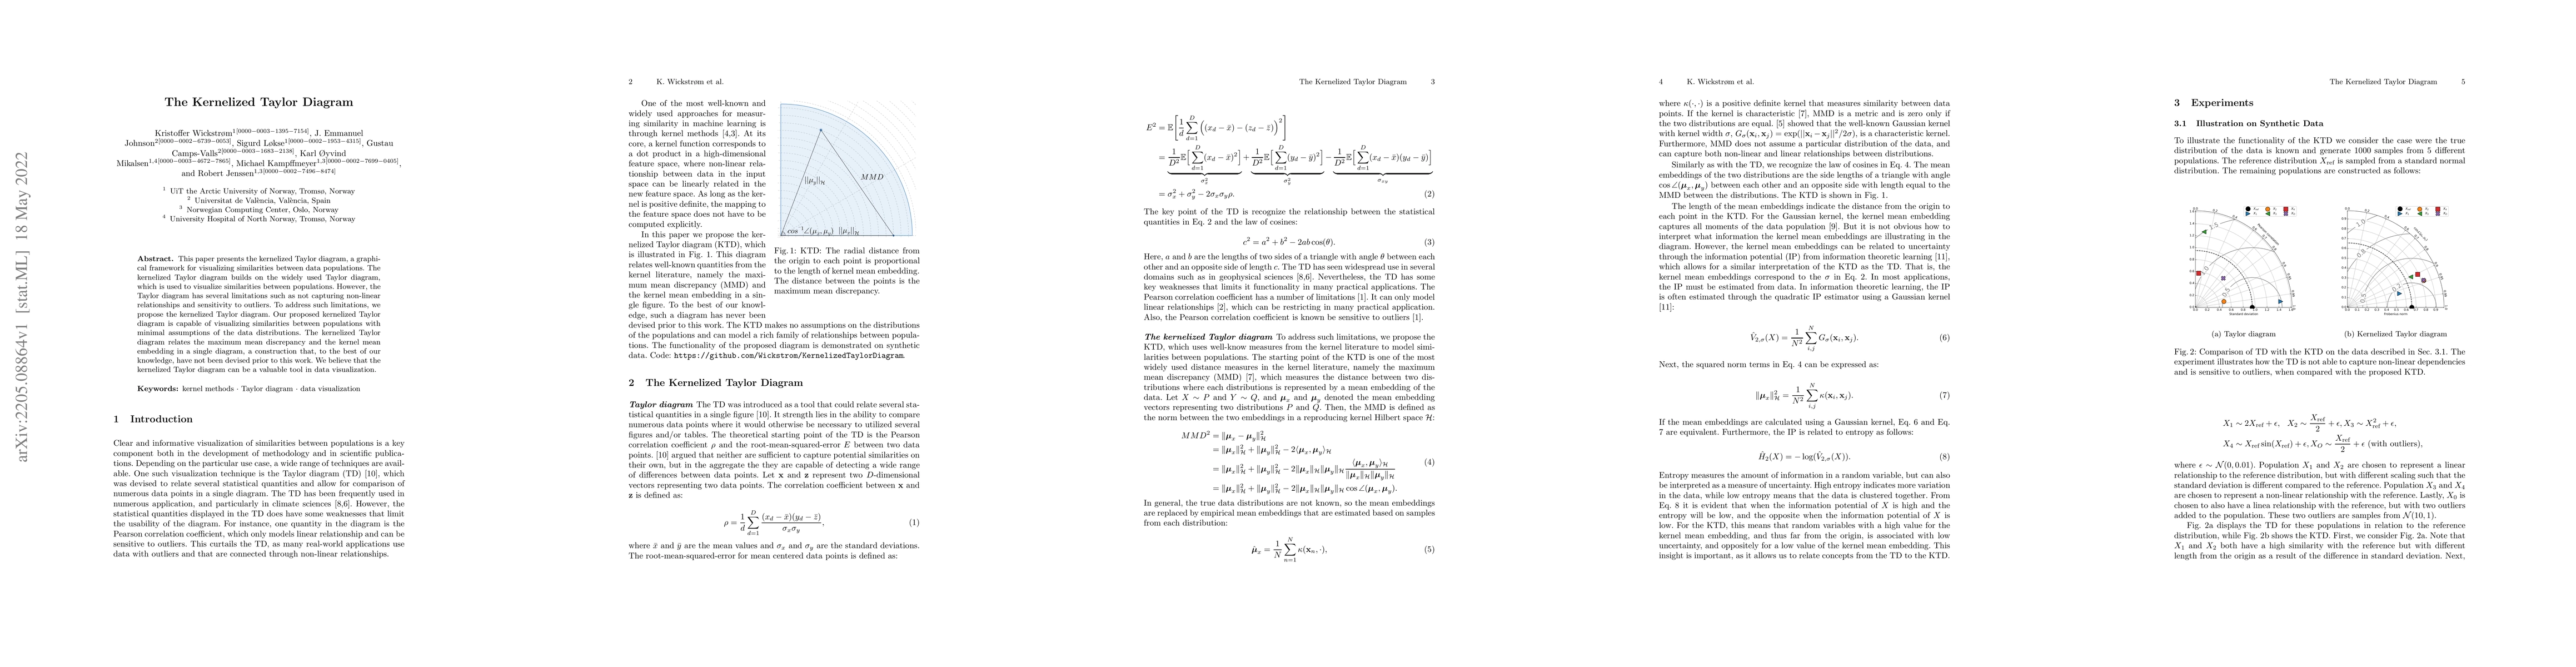
This paper presents the kernelized Taylor diagram, a graphical framework for visualizing similarities between data populations. The kernelized Taylor diagram builds on the widely used Taylor diagram, which is used to visualize similarities between populations. However, the Taylor diagram has several limitations such as not capturing non-linear relationships and sensitivity to outliers. To address such limitations, we propose the kernelized Taylor diagram. Our proposed kernelized Taylor diagram is capable of visualizing similarities between populations with minimal assumptions of the data distributions. The kernelized Taylor diagram relates the maximum mean discrepancy and the kernel mean embedding in a single diagram, a construction that, to the best of our knowledge, have not been devised prior to this work. We believe that the kernelized Taylor diagram can be a valuable tool in data visualization.
AI Key Findings
Get AI-generated insights about this paper's methodology, results, significance, and more — seven facets brought into focus.
Impact
Paper Details
Authors
PDF Preview
Key Terms
Citation Network
Current paper (gray), citations (green), references (blue)
Display is limited for performance on very large graphs.
Discussion 0