The Pie: How Has Human Evolution Distributed Non-Financial Wealth?
Publication
Metrics
AI Quick Summary
This paper investigates the distribution of non-financial wealth in human evolution using the Gini Index to analyze intrinsic human attributes like height and strength. It finds a natural range of inequality (Gini=0.02 to 0.51) that historically established acceptable bounds of inequality, suggesting that modern income distributions align with this range, while wealth distributions, especially in the U.S., do not.
Paper Preview
Abstract
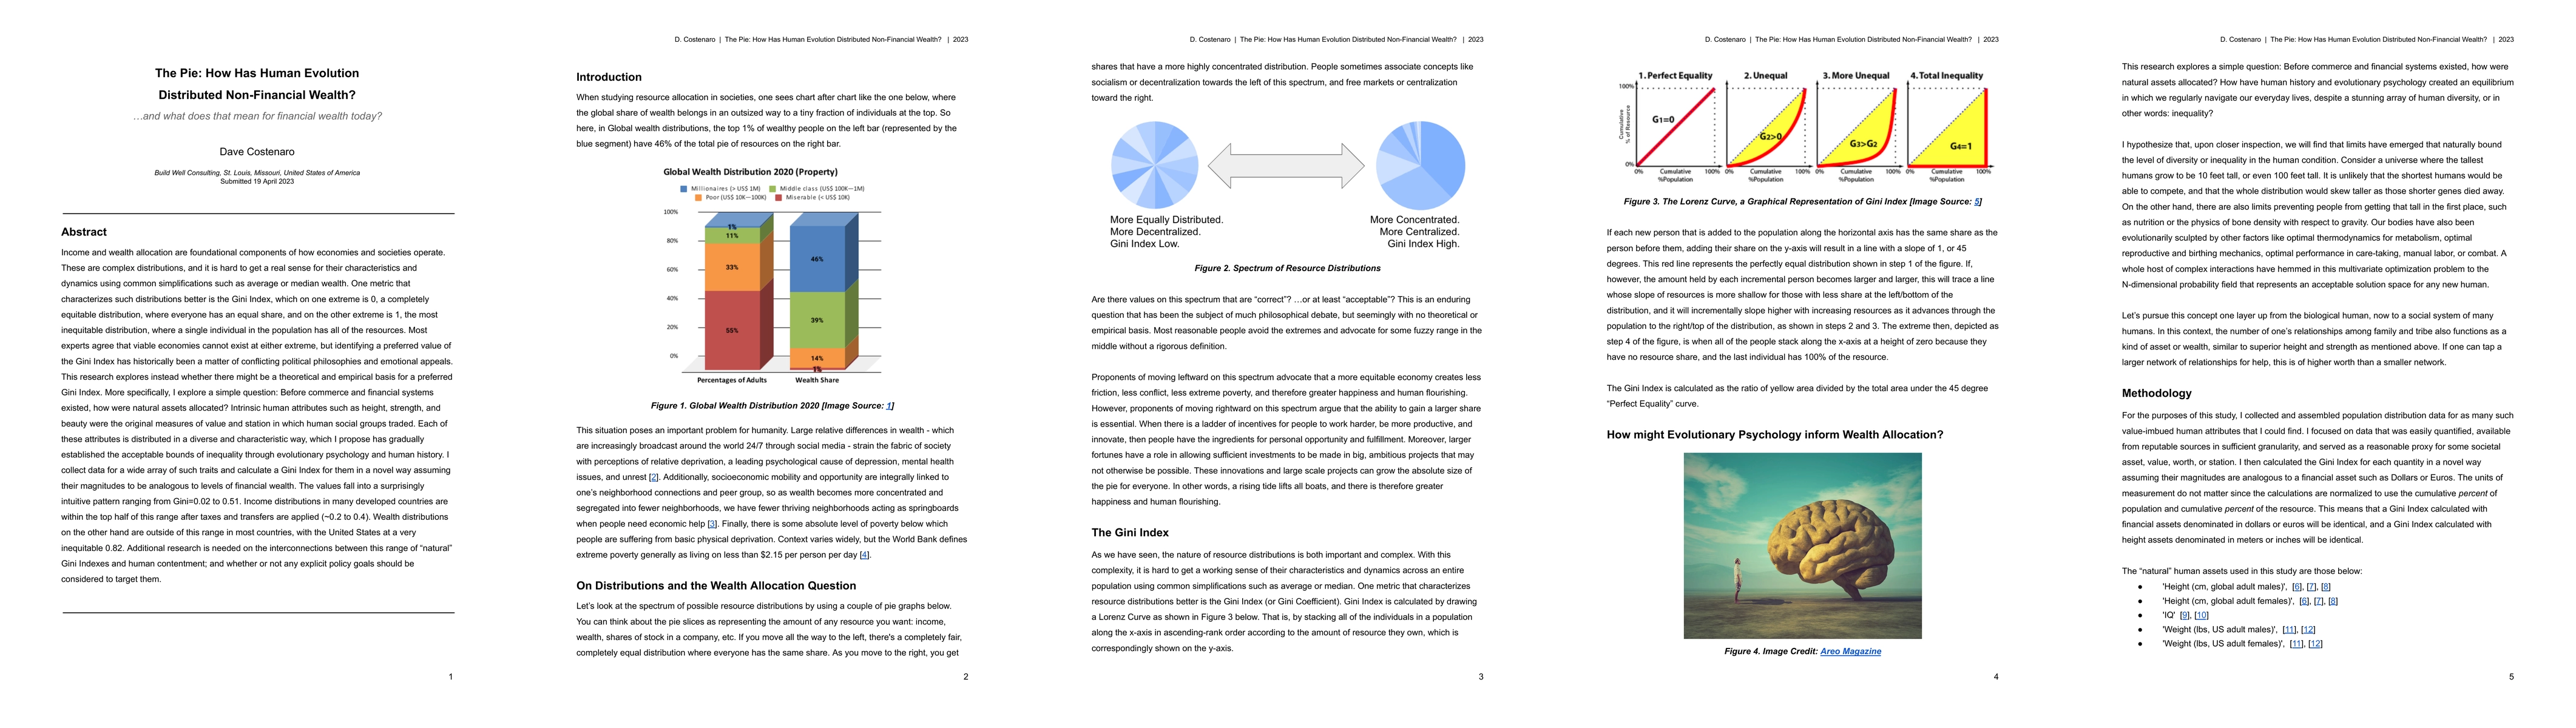
Income and wealth allocation are foundational components of how economies operate. These are complex distributions, and it is hard to get a real sense for their dynamics using simplifications like average or median. One metric that characterizes such distributions better is the Gini Index, which on one extreme is 0, a completely equitable distribution, and on the other extreme is 1, the most inequitable, where a single individual has all the resources. Most experts agree that viable economies cannot exist at either extreme, but identifying a preferred range has historically been a matter of conflicting political philosophies and emotional appeals. This research explores instead whether there might be a theoretical and empirical basis for a preferred Gini Index. Specifically, I explore a simple question: Before financial systems existed, how were natural assets allocated? Intrinsic human attributes such as height, strength, & beauty were the original measures of value in which human social groups traded. Each of these attributes is distributed in a diverse and characteristic way, which I propose has gradually established the acceptable bounds of inequality through evolutionary psychology. I collect data for a wide array of such traits and calculate a Gini Index for them in a novel way assuming their magnitudes to be analogous to levels of financial wealth. The values fall into a surprisingly intuitive pattern ranging from Gini=0.02 to 0.51. Income distributions in many countries are within the top half of this range after taxes and transfers are applied (0.2 to 0.4). Wealth distributions on the other hand are mostly outside of this range, with the United States at a very inequitable 0.82. Additional research is needed on the interconnections between this range of "natural" Gini Indexes and human contentment; and whether any explicit policy goals should be considered to target them.
AI Key Findings
Get AI-generated insights about this paper's methodology, results, significance, and more — seven facets brought into focus.
Impact
Paper Details
Authors
PDF Preview
Key Terms
Citation Network
Current paper (gray), citations (green), references (blue)
Display is limited for performance on very large graphs.
Discussion 0