Publication
Metrics
AI Quick Summary
This paper reviews 56 visualization corpora used in automated chart analysis, categorizing them based on format, scope, collection method, annotations, and diversity. It identifies common practices, research gaps, and opportunities for future corpora development.
Paper Preview
Abstract
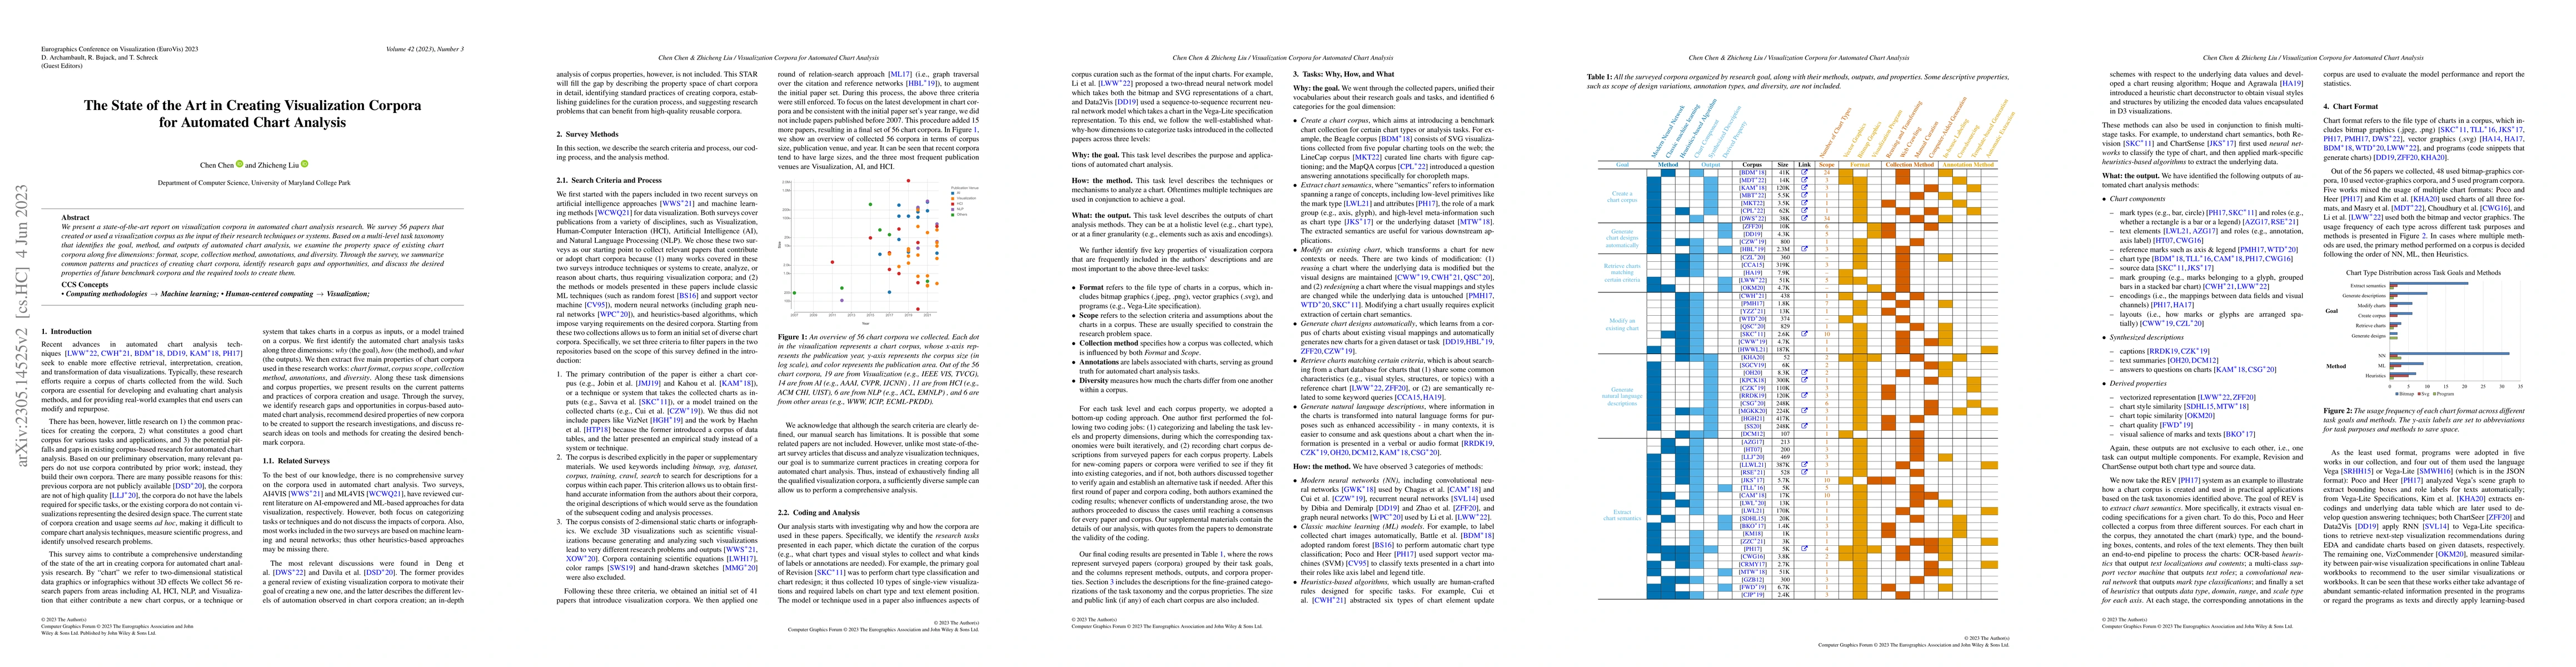
We present a state-of-the-art report on visualization corpora in automated chart analysis research. We survey 56 papers that created or used a visualization corpus as the input of their research techniques or systems. Based on a multi-level task taxonomy that identifies the goal, method, and outputs of automated chart analysis, we examine the property space of existing chart corpora along five dimensions: format, scope, collection method, annotations, and diversity. Through the survey, we summarize common patterns and practices of creating chart corpora, identify research gaps and opportunities, and discuss the desired properties of future benchmark corpora and the required tools to create them.
AI Key Findings
Get AI-generated insights about this paper's methodology, results, significance, and more — seven facets brought into focus.
Impact
Paper Details
Authors
PDF Preview
Key Terms
Citation Network
Current paper (gray), citations (green), references (blue)
Display is limited for performance on very large graphs.
Discussion 0