The Variable Volatility Elasticity Model from Commodity Markets
Publication
Metrics
AI Quick Summary
This paper introduces a novel variable volatility elasticity (VVE) model to better describe asset price processes in commodity markets, addressing the limitations of the constant elasticity of variance (CEV) model. The proposed model captures the positive correlation between volatility and asset prices, offering a more accurate representation of market dynamics and providing an explicit pricing formula for European options akin to the Black-Scholes formula.
Paper Preview
Abstract
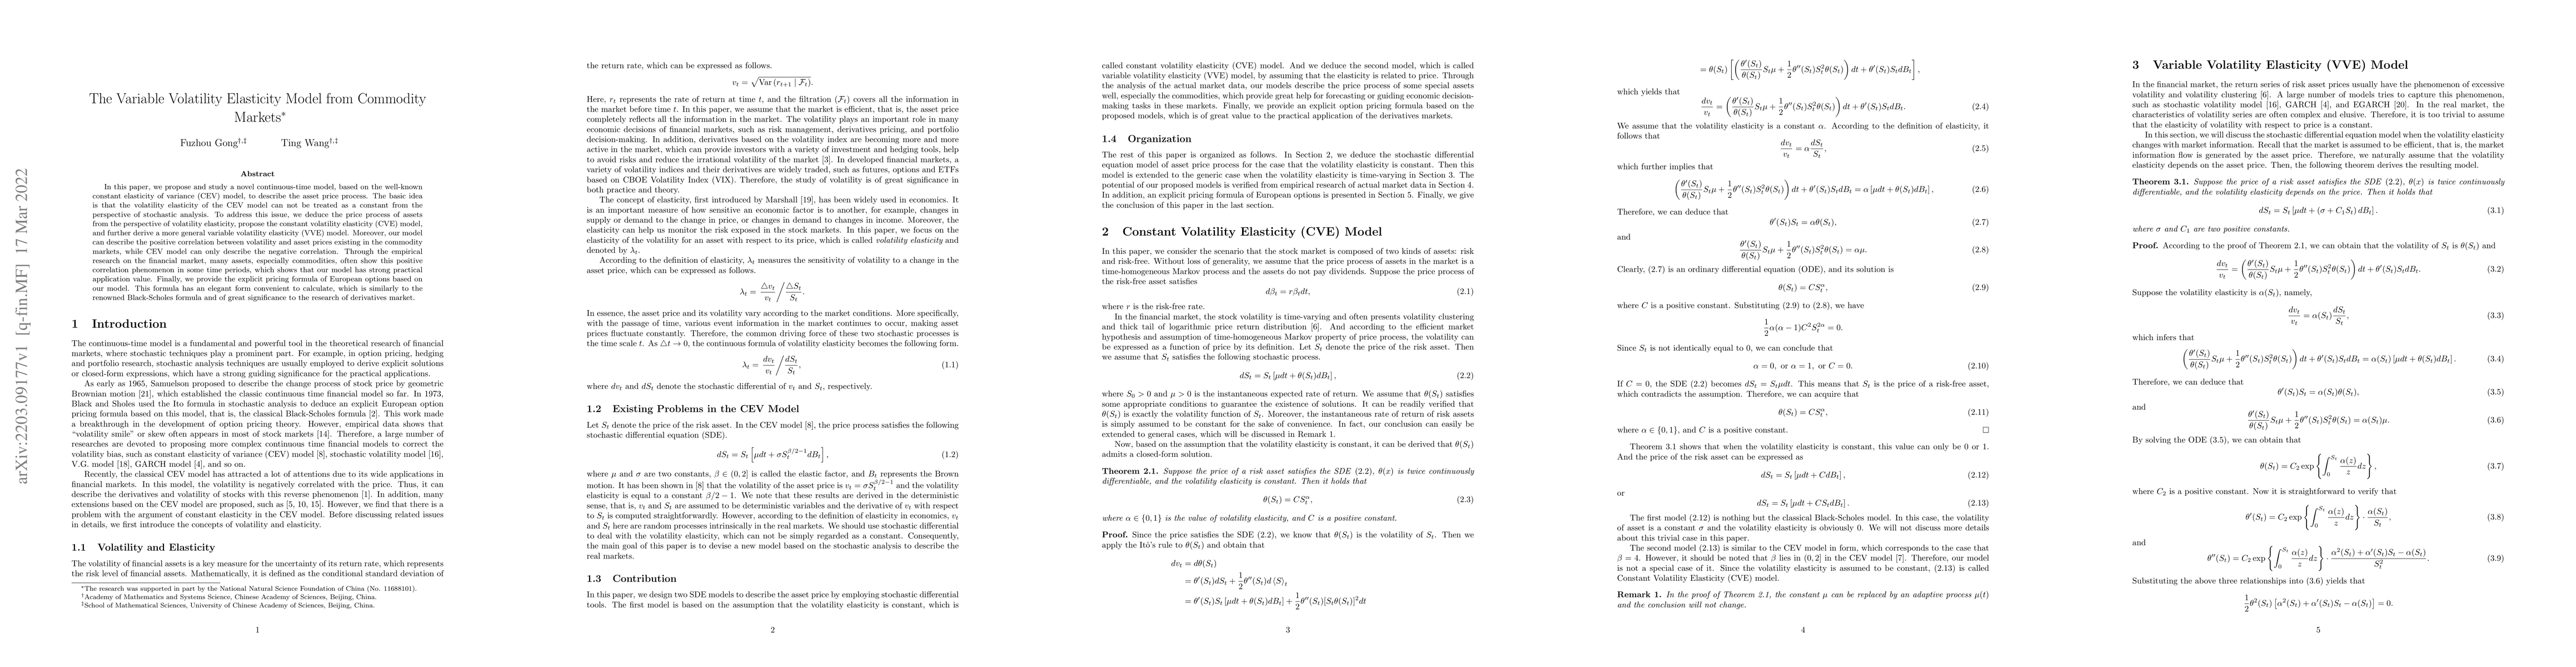
In this paper, we propose and study a novel continuous-time model, based on the well-known constant elasticity of variance (CEV) model, to describe the asset price process. The basic idea is that the volatility elasticity of the CEV model can not be treated as a constant from the perspective of stochastic analysis. To address this issue, we deduce the price process of assets from the perspective of volatility elasticity, propose the constant volatility elasticity (CVE) model, and further derive a more general variable volatility elasticity (VVE) model. Moreover, our model can describe the positive correlation between volatility and asset prices existing in the commodity markets, while CEV model can only describe the negative correlation. Through the empirical research on the financial market, many assets, especially commodities, often show this positive correlation phenomenon in some time periods, which shows that our model has strong practical application value. Finally, we provide the explicit pricing formula of European options based on our model. This formula has an elegant form convenient to calculate, which is similarly to the renowned Black-Scholes formula and of great significance to the research of derivatives market.
AI Key Findings
Get AI-generated insights about this paper's methodology, results, significance, and more — seven facets brought into focus.
Impact
Paper Details
Authors
PDF Preview
Key Terms
Citation Network
Current paper (gray), citations (green), references (blue)
Display is limited for performance on very large graphs.
Discussion 0