Authors
Summary
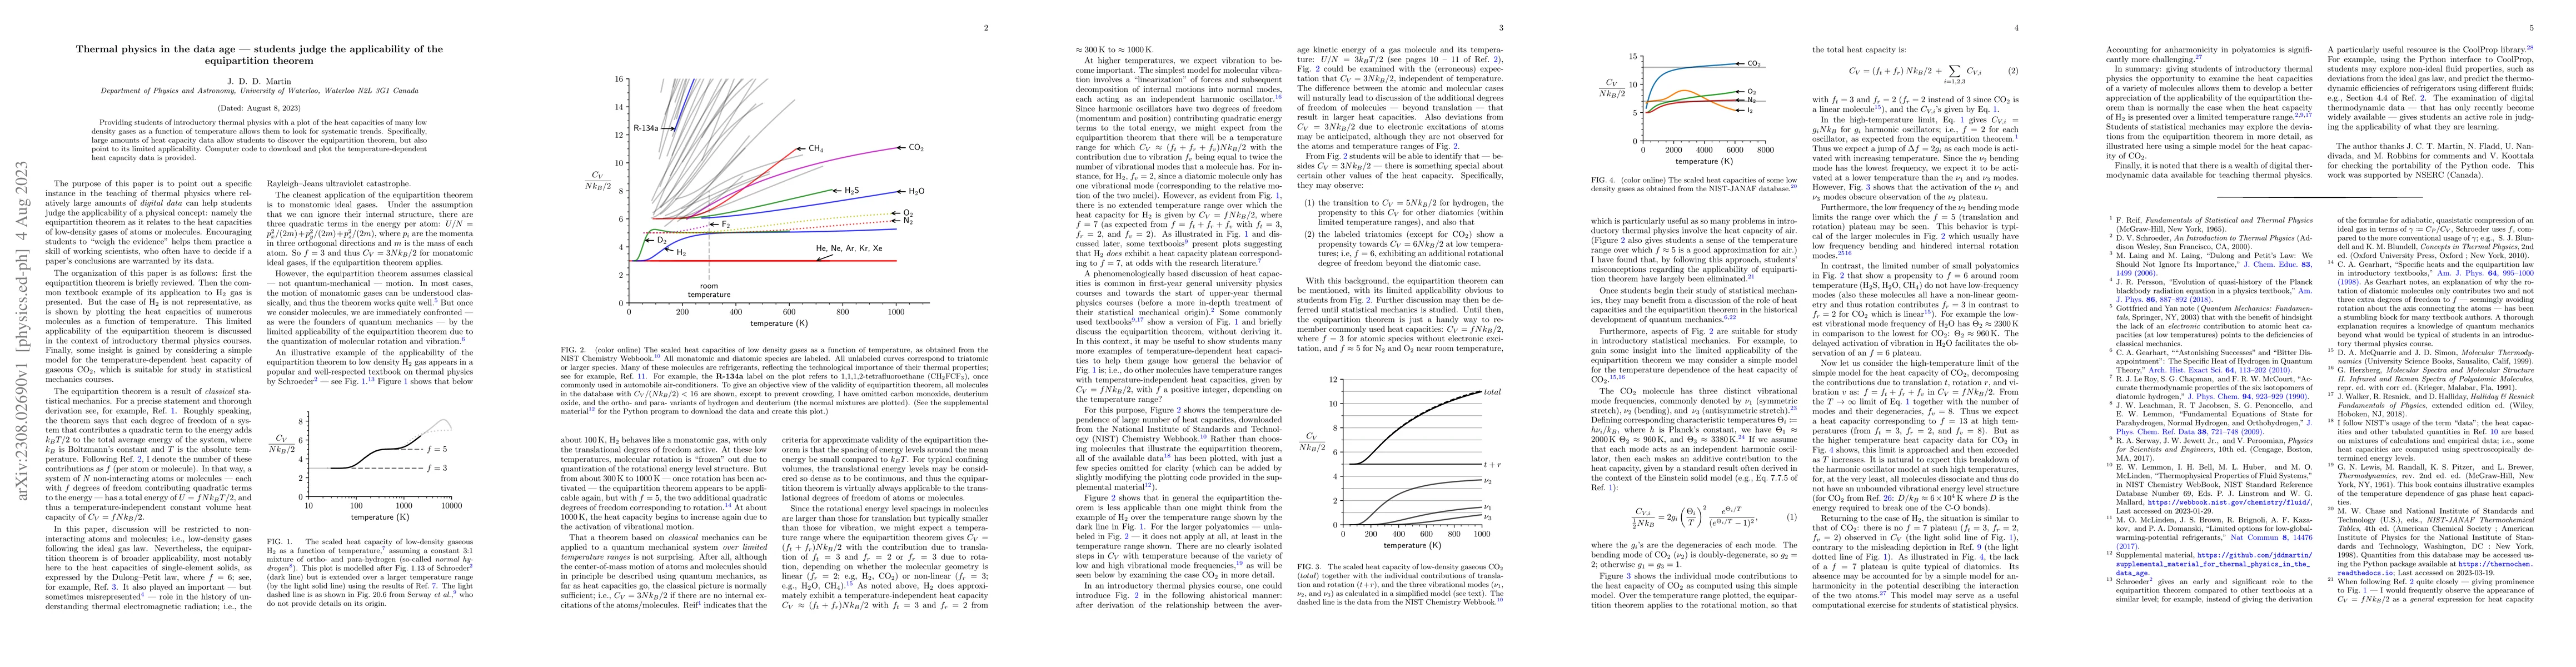
Providing students of introductory thermal physics with a plot of the heat capacities of many low density gases as a function of temperature allows them to look for systematic trends. Specifically, large amounts of heat capacity data allow students to discover the equipartition theorem, but also point to its limited applicability. Computer code to download and plot the temperature-dependent heat capacity data is provided.
AI Key Findings
Get AI-generated insights about this paper's methodology, results, and significance.
Paper Details
PDF Preview
Key Terms
students
(0.382)
heat
(0.349)
students
(0.346)
heat
(0.342)
capacity
(0.302)
capacity
(0.296)
gases
(0.217)
low density
(0.217)
Citation Network
Current paper (gray), citations (green), references (blue)
Display is limited for performance on very large graphs.
Current Paper
Citations
References
Click to view
Similar Papers
Found 4 papersNo citations found for this paper.
Comments (0)