A new framework for extracting data from chart images uses deep learning techniques to detect plot elements with high precision and convert them into meaningful data. Experimental results show the effectiveness of the proposed system in handling various chart data without making assumptions.
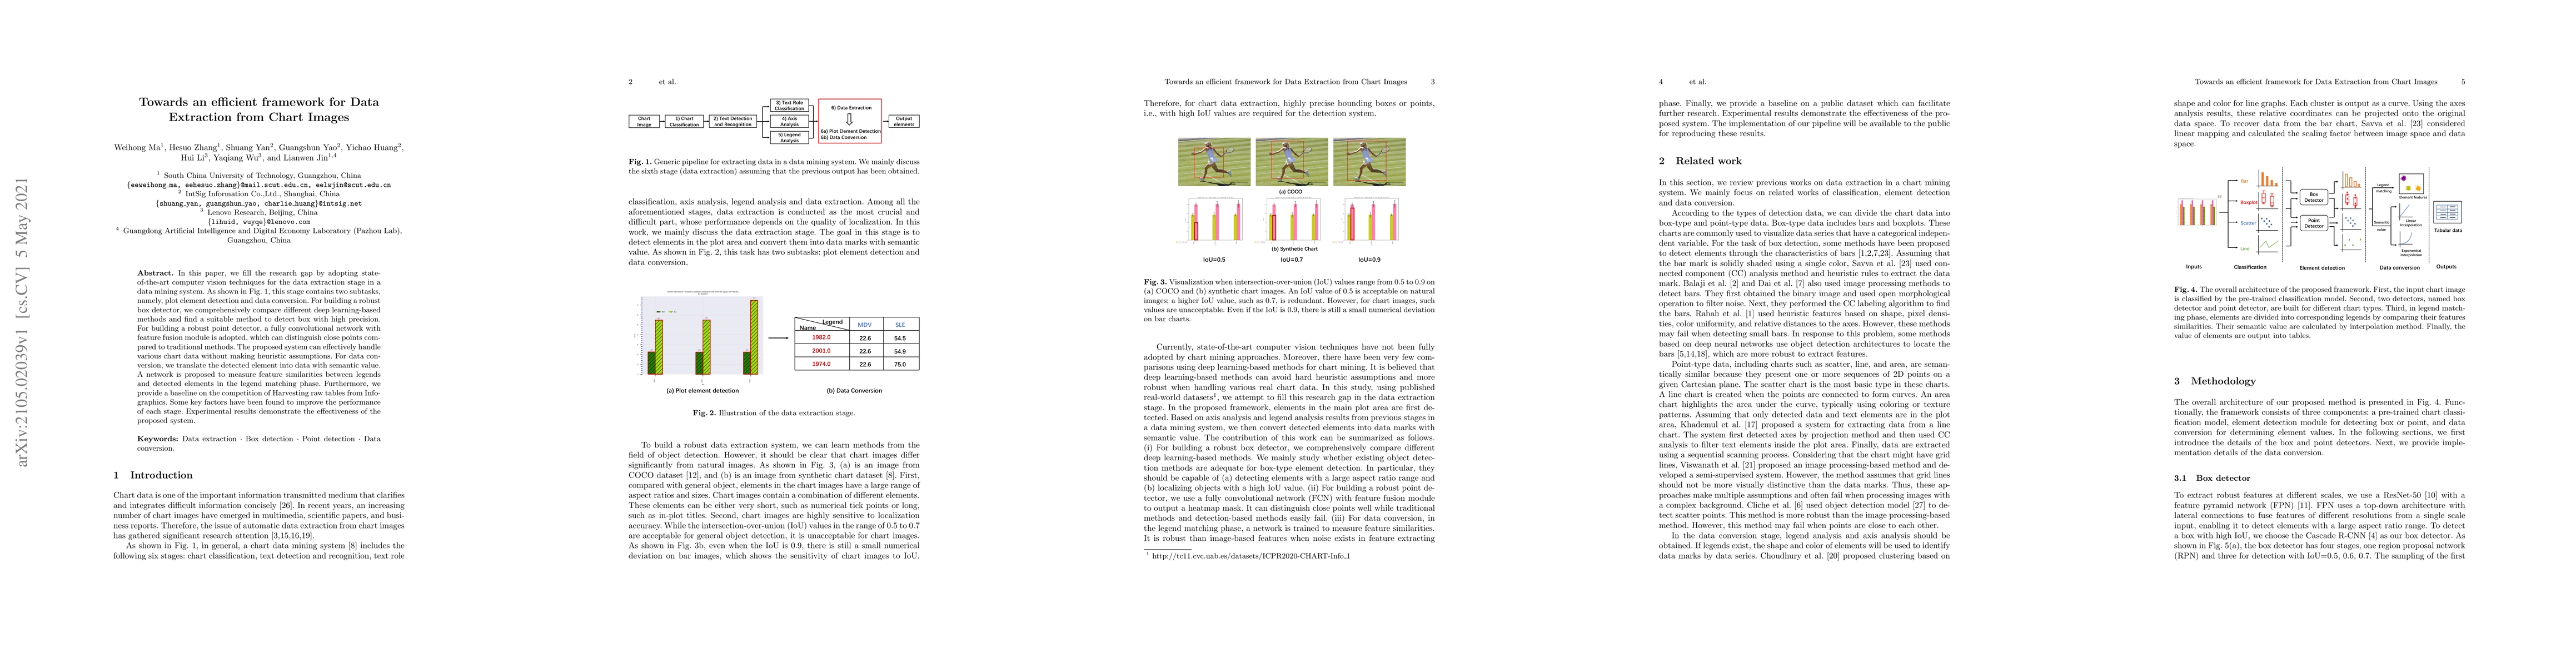
In this paper, we fill the research gap by adopting state-of-the-art computer vision techniques for the data extraction stage in a data mining system. As shown in Fig.1, this stage contains two subtasks, namely, plot element detection and data conversion. For building a robust box detector, we comprehensively compare different deep learning-based methods and find a suitable method to detect box with high precision. For building a robust point detector, a fully convolutional network with feature fusion module is adopted, which can distinguish close points compared to traditional methods. The proposed system can effectively handle various chart data without making heuristic assumptions. For data conversion, we translate the detected element into data with semantic value. A network is proposed to measure feature similarities between legends and detected elements in the legend matching phase. Furthermore, we provide a baseline on the competition of Harvesting raw tables from Infographics. Some key factors have been found to improve the performance of each stage. Experimental results demonstrate the effectiveness of the proposed system.
Get AI-generated insights about this paper's methodology, results, and significance.
Current paper (gray), citations (green), references (blue)
Shufan Li, Congxi Lu, Linkai Li et al.
Osama Mustafa, Imran Siddiqi, Momina Moetesum et al.
Title | Authors | Year | Actions |
---|---|---|---|
Document Parsing Unveiled: Techniques, Challenges, and Prospects for Structured Information Extraction
|
Qintong Zhang, Bin Wang, Victor Shea-Jay Huang, Junyuan Zhang, Zhengren Wang, Hao Liang, Conghui He, Wentao Zhang
|
2024
|
View Paper |
ChartA11y: Designing Accessible Touch Experiences of Visualizations with Blind Smartphone Users
|
Zhuohao Zhang, John R Thompson, Aditi Shah, Manish Agrawal, Alper Sarikaya, Jacob O. Wobbrock, Edward Cutrell, Bongshin Lee
|
2024
|
View Paper |
DCQA: Document-Level Chart Question Answering towards Complex Reasoning and Common-Sense Understanding
|
Anran Wu, Luwei Xiao, Xingjiao Wu, Shuwen Yang, Junjie Xu, Zisong Zhuang, Nian Xie, Cheng Jin, Liang He
|
2023
|
View Paper |
Foundation Models Meet Visualizations: Challenges and Opportunities
|
Weikai Yang, Mengchen Liu, Zheng Wang, Shixia Liu
|
2023
|
View Paper |
An extensible point-based method for data chart value detection
|
Carlos Soto, Shinjae Yoo
|
2023
|
View Paper |
SpaDen : Sparse and Dense Keypoint Estimation for Real-World Chart Understanding
|
Saleem Ahmed, Pengyu Yan, D. Doermann, Srirangaraj Setlur, Venugopal Govindaraju
|
2023
|
View Paper |
Context-Aware Chart Element Detection
|
Pengyu Yan, Saleem Ahmed, D. Doermann
|
2023
|
View Paper |
LineFormer: Rethinking Line Chart Data Extraction as Instance Segmentation
|
Jay Lal, Aditya Mitkari, Mahesh Bhosale, D. Doermann
|
2023
|
View Paper |
Structure Diagram Recognition in Financial Announcements
|
Meixuan Qiao, Jun Wang, Junfu Xiang, Qiyu Hou, Ruixuan Li
|
2023
|
View Paper |
ChartDetective: Easy and Accurate Interactive Data Extraction from Complex Vector Charts
|
Damien Masson, Sylvain Malacria, Daniel Vogel, E. Lank, Géry Casiez
|
2023
|
View Paper |
Review of chart image detection and classification
|
Filip Bajić, Josip Job
|
2023
|
View Paper |
Parsing Line Chart Images Using Linear Programming
|
Hajime Kato, Mitsuru Nakazawa, Hsuan-Kung Yang, Mark Chen, B. Stenger
|
2022
|
View Paper |
uFOIL: An Unsupervised Fusion of Image Processing and Language Understanding
|
Md. Abdur Rahman, Md. Tanzimul Hasan, Umar Farooq Howlader, Md. Abdul Kader, Md. Motaharul Islam, Phuoc Hung Pham, Mohammad Mehedi Hassan
|
2025
|
View Paper |
Comments (0)