Understanding stock market instability via graph auto-encoders
Publication
Metrics
AI Quick Summary
This paper proposes using graph auto-encoders to predict stock market instability by measuring the reconstruction error of financial networks. Higher reconstruction error values correlate with increased market volatility, enhancing out-of-sample volatility forecasting models.
Paper Preview
Abstract
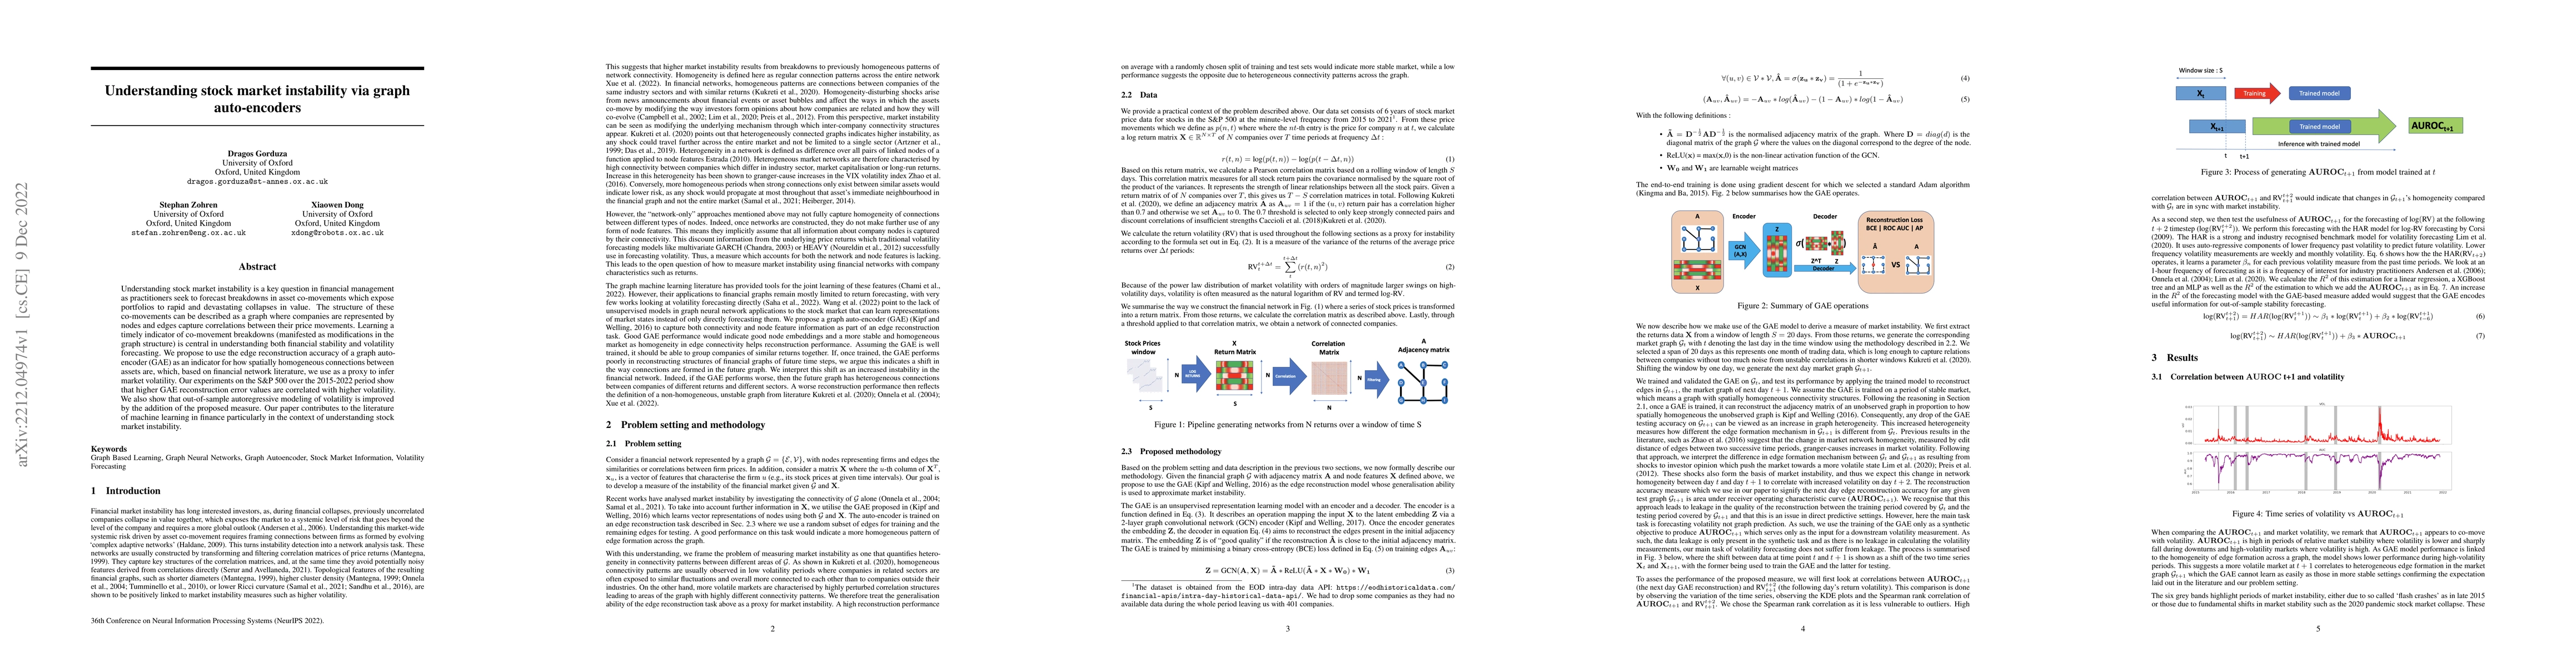
Understanding stock market instability is a key question in financial management as practitioners seek to forecast breakdowns in asset co-movements which expose portfolios to rapid and devastating collapses in value. The structure of these co-movements can be described as a graph where companies are represented by nodes and edges capture correlations between their price movements. Learning a timely indicator of co-movement breakdowns (manifested as modifications in the graph structure) is central in understanding both financial stability and volatility forecasting. We propose to use the edge reconstruction accuracy of a graph auto-encoder (GAE) as an indicator for how spatially homogeneous connections between assets are, which, based on financial network literature, we use as a proxy to infer market volatility. Our experiments on the S&P 500 over the 2015-2022 period show that higher GAE reconstruction error values are correlated with higher volatility. We also show that out-of-sample autoregressive modeling of volatility is improved by the addition of the proposed measure. Our paper contributes to the literature of machine learning in finance particularly in the context of understanding stock market instability.
AI Key Findings
Get AI-generated insights about this paper's methodology, results, significance, and more — seven facets brought into focus.
Impact
Paper Details
Authors
PDF Preview
Key Terms
Citation Network
Current paper (gray), citations (green), references (blue)
Display is limited for performance on very large graphs.
Discussion 0