Unraveling Fundamental Properties of Power System Resilience Curves using Unsupervised Machine Learning
Publication
Metrics
AI Quick Summary
This study employs unsupervised machine learning to analyze over 200 power system resilience curves from extreme weather events, identifying two primary archetypes: triangular and trapezoidal. The triangular archetype is defined by critical functionality threshold, recovery rate, and recovery pivot point, while the trapezoidal archetype is characterized by sustained function loss duration and constant recovery rate.
Paper Preview
Abstract
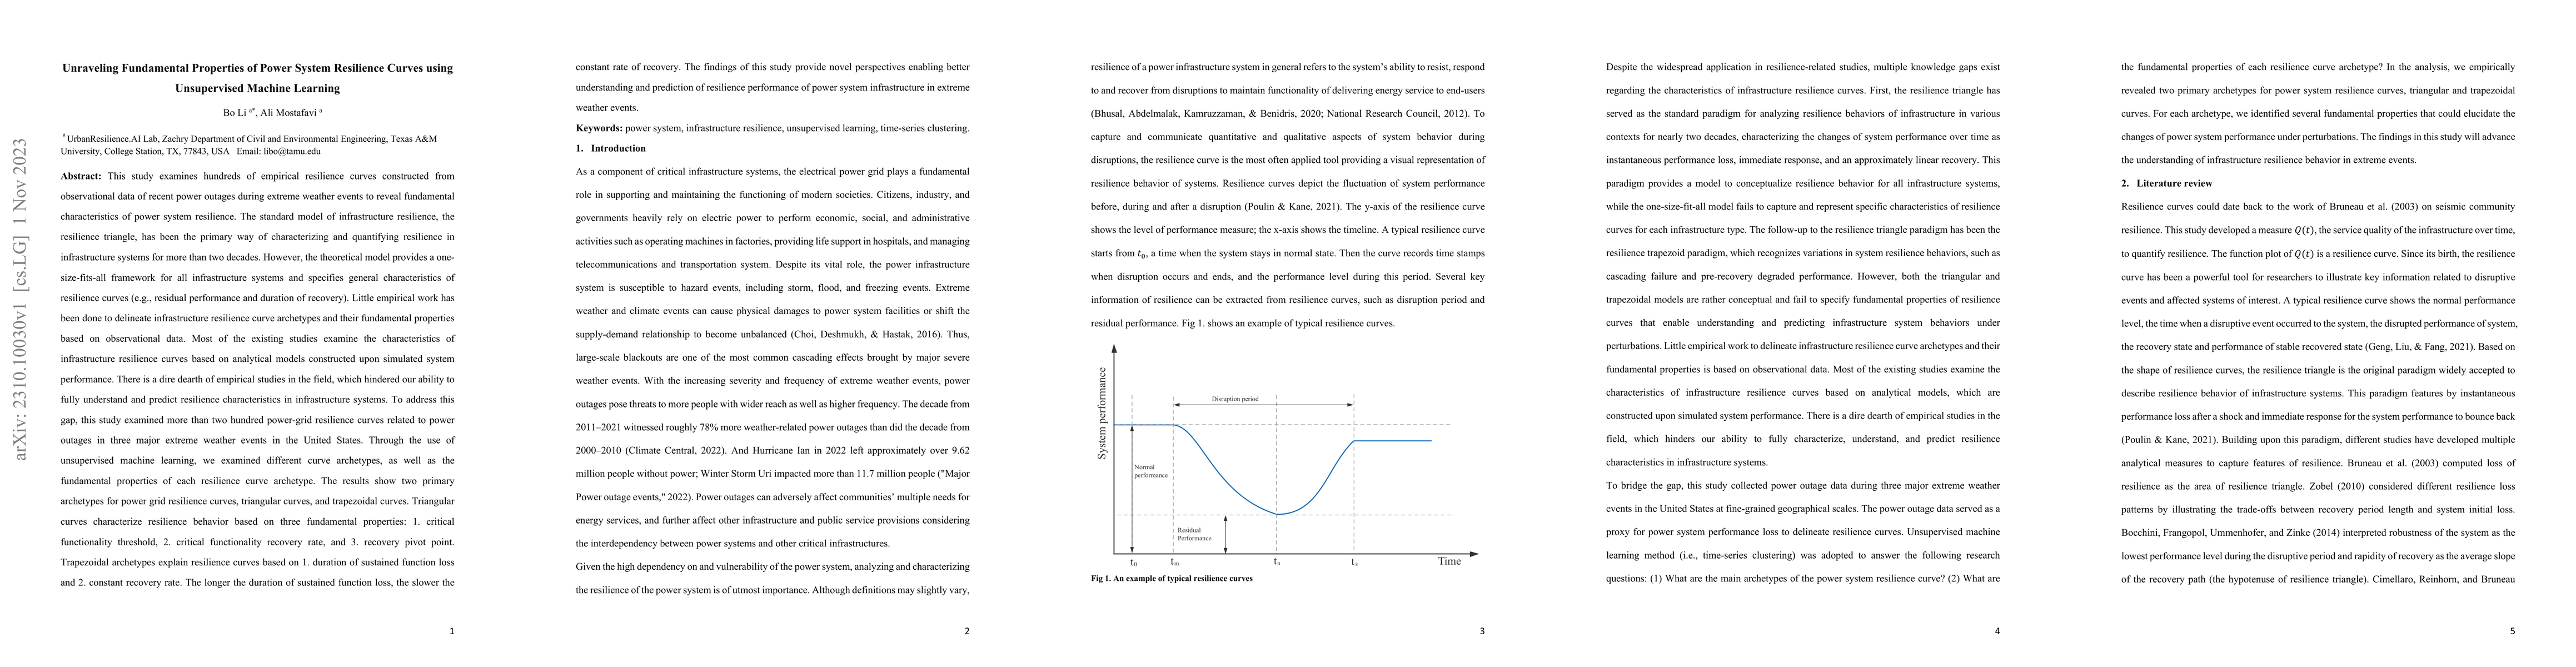
The standard model of infrastructure resilience, the resilience triangle, has been the primary way of characterizing and quantifying infrastructure resilience. However, the theoretical model merely provides a one-size-fits-all framework for all infrastructure systems. Most of the existing studies examine the characteristics of infrastructure resilience curves based on analytical models constructed upon simulated system performance. Limited empirical studies hindered our ability to fully understand and predict resilience characteristics in infrastructure systems. To address this gap, this study examined over 200 resilience curves related to power outages in three major extreme weather events. Using unsupervised machine learning, we examined different curve archetypes, as well as the fundamental properties of each resilience curve archetype. The results show two primary archetypes for power system resilience curves, triangular, and trapezoidal curves. Triangular curves characterize resilience behavior based on 1. critical functionality threshold, 2. critical functionality recovery rate, and 3. recovery pivot point. Trapezoidal archetypes explain resilience curves based on 1. duration of sustained function loss and 2. constant recovery rate. The longer the duration of sustained function loss, the slower the constant rate of recovery. The findings of this study provide novel perspectives enabling better understanding and prediction of resilience performance of power system infrastructures.
AI Key Findings
Get AI-generated insights about this paper's methodology, results, significance, and more — seven facets brought into focus.
Impact
Paper Details
Authors
PDF Preview
Key Terms
Citation Network
Current paper (gray), citations (green), references (blue)
Display is limited for performance on very large graphs.
Discussion 0