Summary
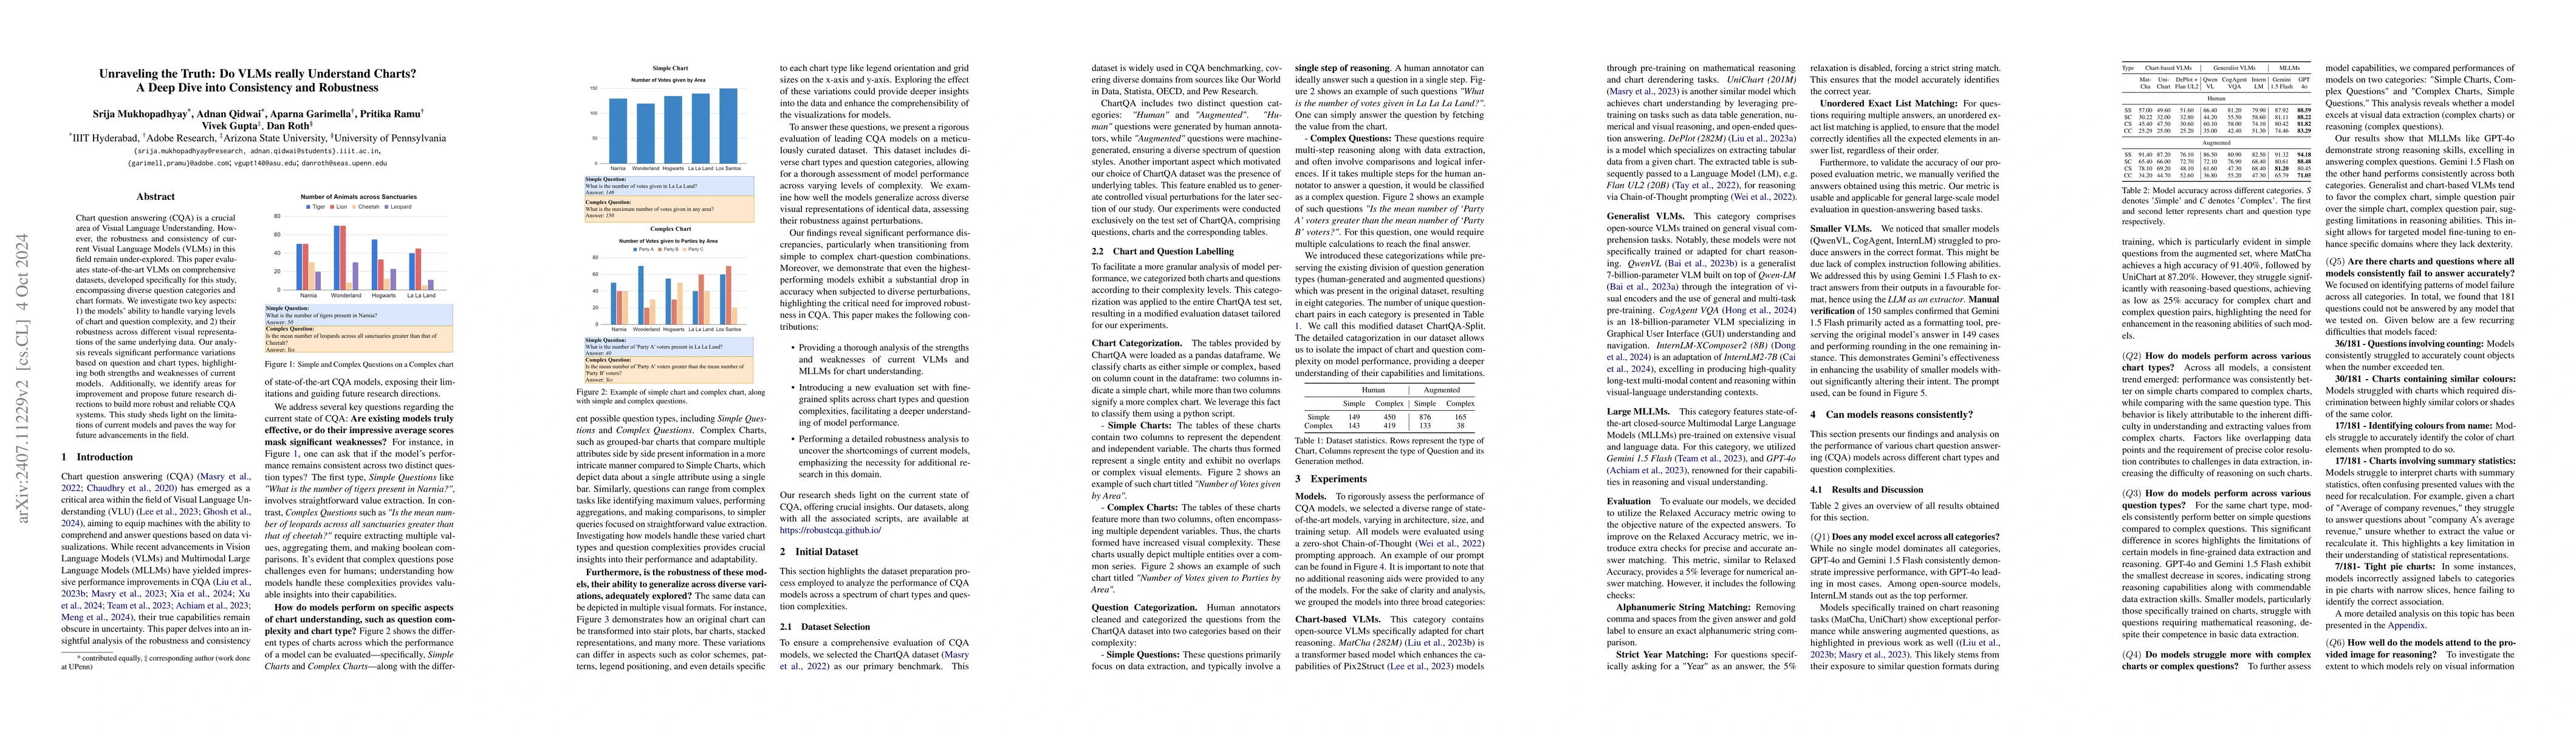
Chart question answering (CQA) is a crucial area of Visual Language Understanding. However, the robustness and consistency of current Visual Language Models (VLMs) in this field remain under-explored. This paper evaluates state-of-the-art VLMs on comprehensive datasets, developed specifically for this study, encompassing diverse question categories and chart formats. We investigate two key aspects: 1) the models' ability to handle varying levels of chart and question complexity, and 2) their robustness across different visual representations of the same underlying data. Our analysis reveals significant performance variations based on question and chart types, highlighting both strengths and weaknesses of current models. Additionally, we identify areas for improvement and propose future research directions to build more robust and reliable CQA systems. This study sheds light on the limitations of current models and paves the way for future advancements in the field.
AI Key Findings
Get AI-generated insights about this paper's methodology, results, and significance.
Paper Details
PDF Preview
Key Terms
Citation Network
Current paper (gray), citations (green), references (blue)
Display is limited for performance on very large graphs.
Similar Papers
Found 4 papersTempCompass: Do Video LLMs Really Understand Videos?
Lei Li, Yi Liu, Lu Hou et al.
Learning on Graphs with Large Language Models(LLMs): A Deep Dive into Model Robustness
Jiliang Tang, Kai Guo, Zewen Liu et al.
No citations found for this paper.
Comments (0)