Background
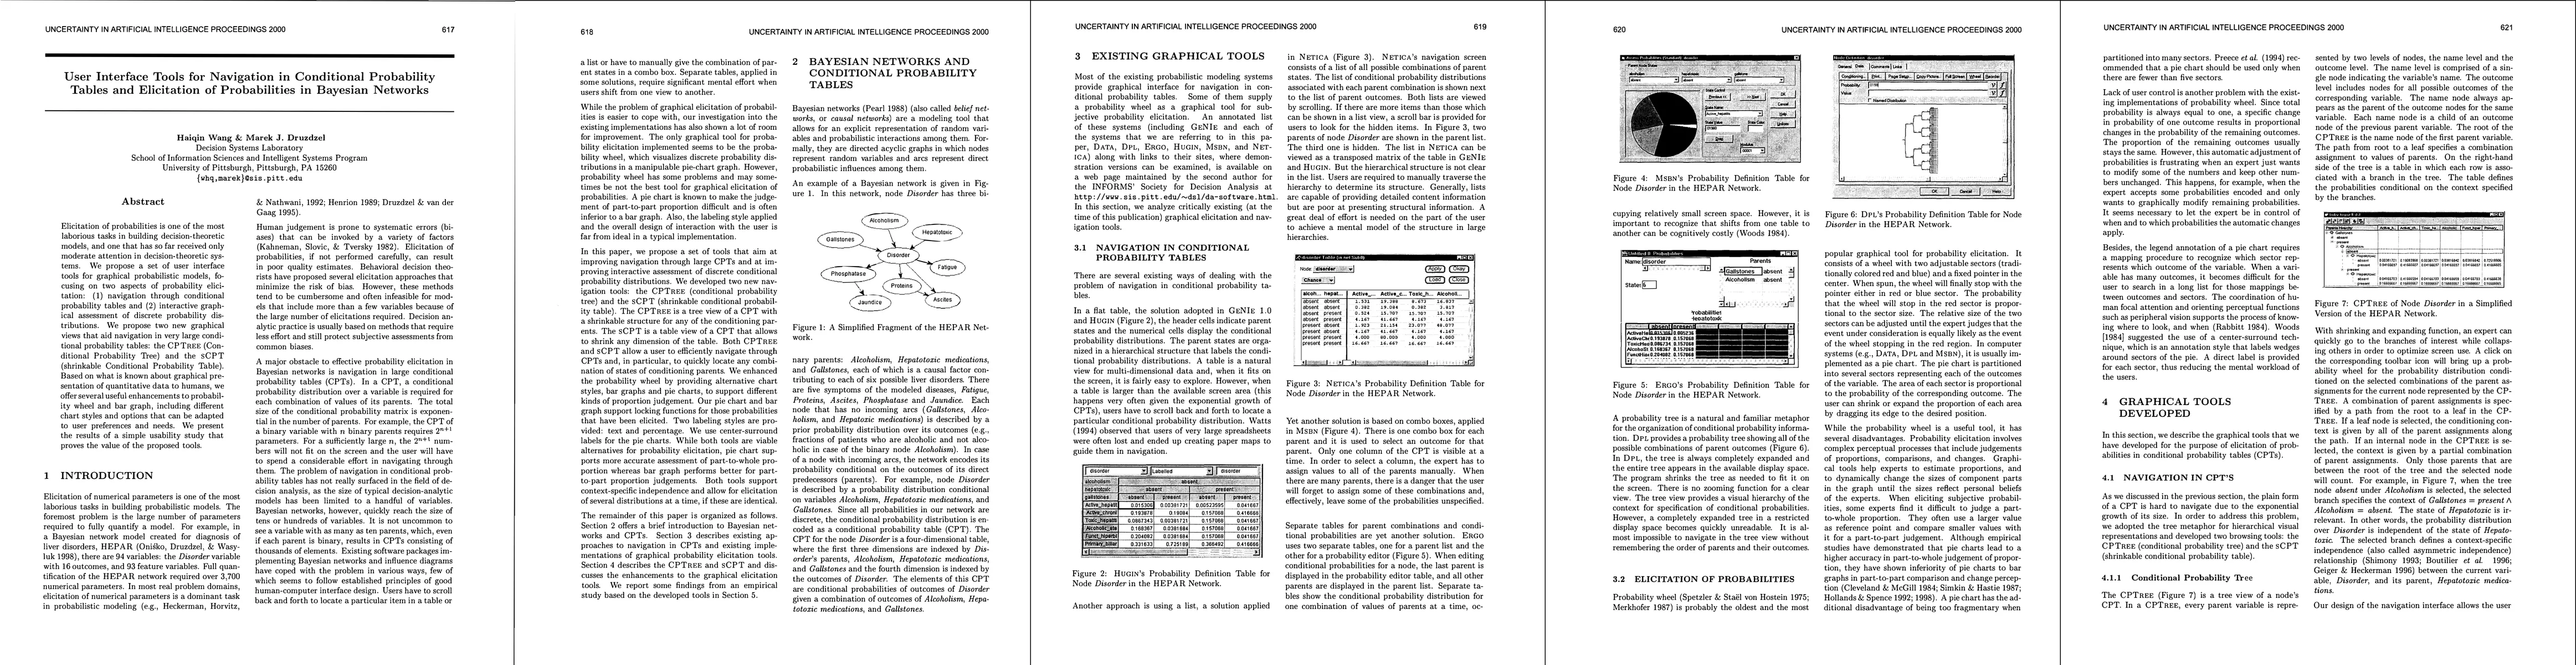
Bayesian networks are a formalism for representing random variables and their probabilistic dependencies as a directed acyclic graph. Each node corresponds to a discrete variable, and each node with parents carries a conditional probability distribution (its CPT) conditioned on the joint outcomes of its parents. The CPTs can become extremely large when a node has multiple parents, especially if each parent is binary, yielding an exponential growth in the number of parameters. The paper uses the liver-disease diagnosis network HEPAR as a motivating example, noting that a 94-variable network can require thousands of probability parameters. This combinatorial explosion creates a critical navigation challenge: users must locate, inspect, and elicit many conditional distributions across a vast CPT, often beyond screen space.
Problem / Research Question
The central problem is twofold: (1) how to efficiently navigate very large CPTs so that experts can quickly locate and specify conditional distributions, and (2) how to elicit discrete probability distributions interactively in a way that reduces cognitive load and biases compared with traditional widgets (e.g., wheels or flat tables). The authors ask whether tree- and shrinkable-table metaphors, along with enhanced probability elicitation interfaces, can improve both speed and accuracy of elicitation, while supporting context-specific independence and flexible user preferences.
Innovation / Contribution
The paper makes several key innovations:
- CPTREE: a tree-based CPT navigator that represents each parent with a name node and outcome nodes, enabling a navigable, hierarchical view. Branching encodes the conditioning context and can be expanded or shrunk to fit display space. A selected path defines a conditioning context, enabling focus on relevant branches and explicit context-specific independence (asymmetric independence).
- sCPT: a shrinkable CPT that combines high data density with a tree-structured view. Users can collapse or expand header ranges to reveal or hide subranges, enabling rapid tracing of probability blocks across multiple parent combinations.
- Enhanced probability elicitation tools: improved probability wheels (pie chart) and bar graphs with features such as locking of certain sectors/bars, center-surround labeling for efficient mapping, and options to show text labels or numeric percentages. These tools support both part-to-whole and part-to-part judgments and accommodate user preferences.
- Context-specific independence and multi-distribution elicitation: both CPTREE and sCPT explicitly support context-specific independence, and allow eliciting several distributions simultaneously when identical across contexts. This reduces duplicate input and cognitive load.
- Implementation and empirical validation: integration into GENIE 2.0, with a focus on usability and model-building workflow. The authors report a controlled usability study comparing pie charts, bar graphs, and direct numerical elicitation, showing clear performance advantages for bar graphs and graphical elicitation overall.
Methodology / Approach
CPTREE represents a CPT as a tree where each parent contributes a level of branching. The root starts with the first parent’s name, and each subsequent parent adds a level of outcomes, forming a path from root to leaf that encodes a complete parent-state combination. The right-hand side of the CPTREE shows a table with the conditional probabilities conditioned on that path. The tree can be shrunk or expanded, and the order of parents can be rearranged to reflect causal or cognitive ordering for the user. Multiple branch selections can be elicited in parallel, enabling the user to input identical probabilities across several contexts efficiently.
The sCPT offers a dense, columnar view where header rows define ranges, and all columns within a covered range are treated as children items. A user can trace a probability branch by following a path through headers and their covered ranges. This structure increases data density, making it possible to see more of the CPT on screen while maintaining a navigable organization.
For probability assessment, the authors implement two chart styles: pie charts and bar graphs. Interaction consists of dragging handles to adjust probabilities. The tools support locking of particular outcomes, so adjustments to one part do not automatically perturb locked parts. Labels can be shown as text or as percentages; center-surround labeling improves label-perception mapping to pie sectors.
The empirical verification involved a usability study comparing the graphical approaches to direct numerical elicitation, as well as a comparison between the two graphical modes. The study found that graphical elicitation was faster and more accurate than direct numerical input, with bar graphs outperforming the pie charts on both speed and accuracy. Qualitative feedback indicated users valued the navigational tools and preferred graphical methods overall, though preferences varied across individuals, underscoring the value of offering multiple approaches.
Experiments / Evaluation
The authors report an empirical study conducted within the GENIE framework. They compared pie chart elicitation, bar graph elicitation, and direct numerical input across tasks involving conditional probability distributions. The bar graph method yielded the best performance: approximately 11% higher accuracy and 41% faster than direct elicitation, and about 3% higher accuracy and 35% faster than the pie chart. The study also collected qualitative feedback indicating that users appreciated the navigational enhancements and graphical elicitation, with some variation in personal preference.
Space limitations prevented a full report of all study details, but the authors note that graphical elicitation was generally faster and more accurate than direct input, while bar graphs tended to outperform pie charts for accuracy and speed. They also acknowledge limitations, such as difficulty eliciting very small probabilities within their screen resolution and mouse sensitivity constraints, and the lack of explicit visualization for which probabilities had already been elicited.
Key Results
Across CPT navigation and probability elicitation, the main outcomes are: (1) CPTREE and sCPT provide scalable, navigable visualizations for large CPTs, enabling efficient access to conditioning contexts and context-specific independence; (2) probability elicitation tools (bar graphs and pies) offer intuitive, adjustable interfaces with locking to preserve user-specified values; (3) empirical evaluation shows bar-graph elicitation outperforms pie-charts and direct numerical entry in speed and accuracy; (4) users value graphical navigation and prefer multiple elicitation modalities to accommodate individual differences; (5) GENIE 2.0 emerges as a practical platform for deploying these tools in real-world BN modeling.
Practical Applications
The immediate application is in building and refining Bayesian networks for complex domains, such as medical diagnosis, where CPTs can be voluminous (e.g., the HEPAR network with thousands of parameters). The CPTREE and sCPT tools reduce the cognitive and operational burden of navigating and eliciting CPT values, accelerating model construction and potentially improving the quality of the elicited probabilities through more accurate judgments. The authors also suggest applicability beyond Bayesian networks to other graphical probabilistic structures (e.g., chain graphs) and potential extensions to utility nodes and canonical probabilistic interactions like Noisy-OR or Noisy-AND. The broader implication is a more usable, human-centered interface in decision-analytic modeling tools, increasing the adoption and reliability of probabilistic reasoning in practice.
Limitations & Considerations
The study acknowledges several limitations: first, the current tools struggle with eliciting very small probabilities due to screen resolution and mouse sensitivity, necessitating manual input for those values. Second, some users found a preference for different modalities, indicating a need for flexible, multi-mode support. Third, the evaluation focused on specific graphical modalities within GENIE 2.0 and may not generalize across domains or devices (e.g., touch interfaces). Fourth, there is an incomplete mechanism to highlight which probabilities have already been elicited, which could affect usability during ongoing model development. Finally, while 3-D displays were discussed and dismissed based on prior work, broader validation across devices and use-cases could further inform UI choices and scalability when CPTs grow even larger or when multiple variables and outcomes interact in more complex ways.
Discussion 0