Using Processing Fluency as a Metric of Trust in Scatterplot Visualizations
Publication
Metrics
AI Quick Summary
This research investigates how processing fluency—the speed and accuracy of perceiving and processing a visualization—affects trust in scatterplot visualizations. Experiments show that camouflaged visualizations, which reduce processing fluency, lead to less accurate data estimations and lower trust in associated companies, indicating that fluency is crucial for perceived trustworthiness.
Paper Preview
Abstract
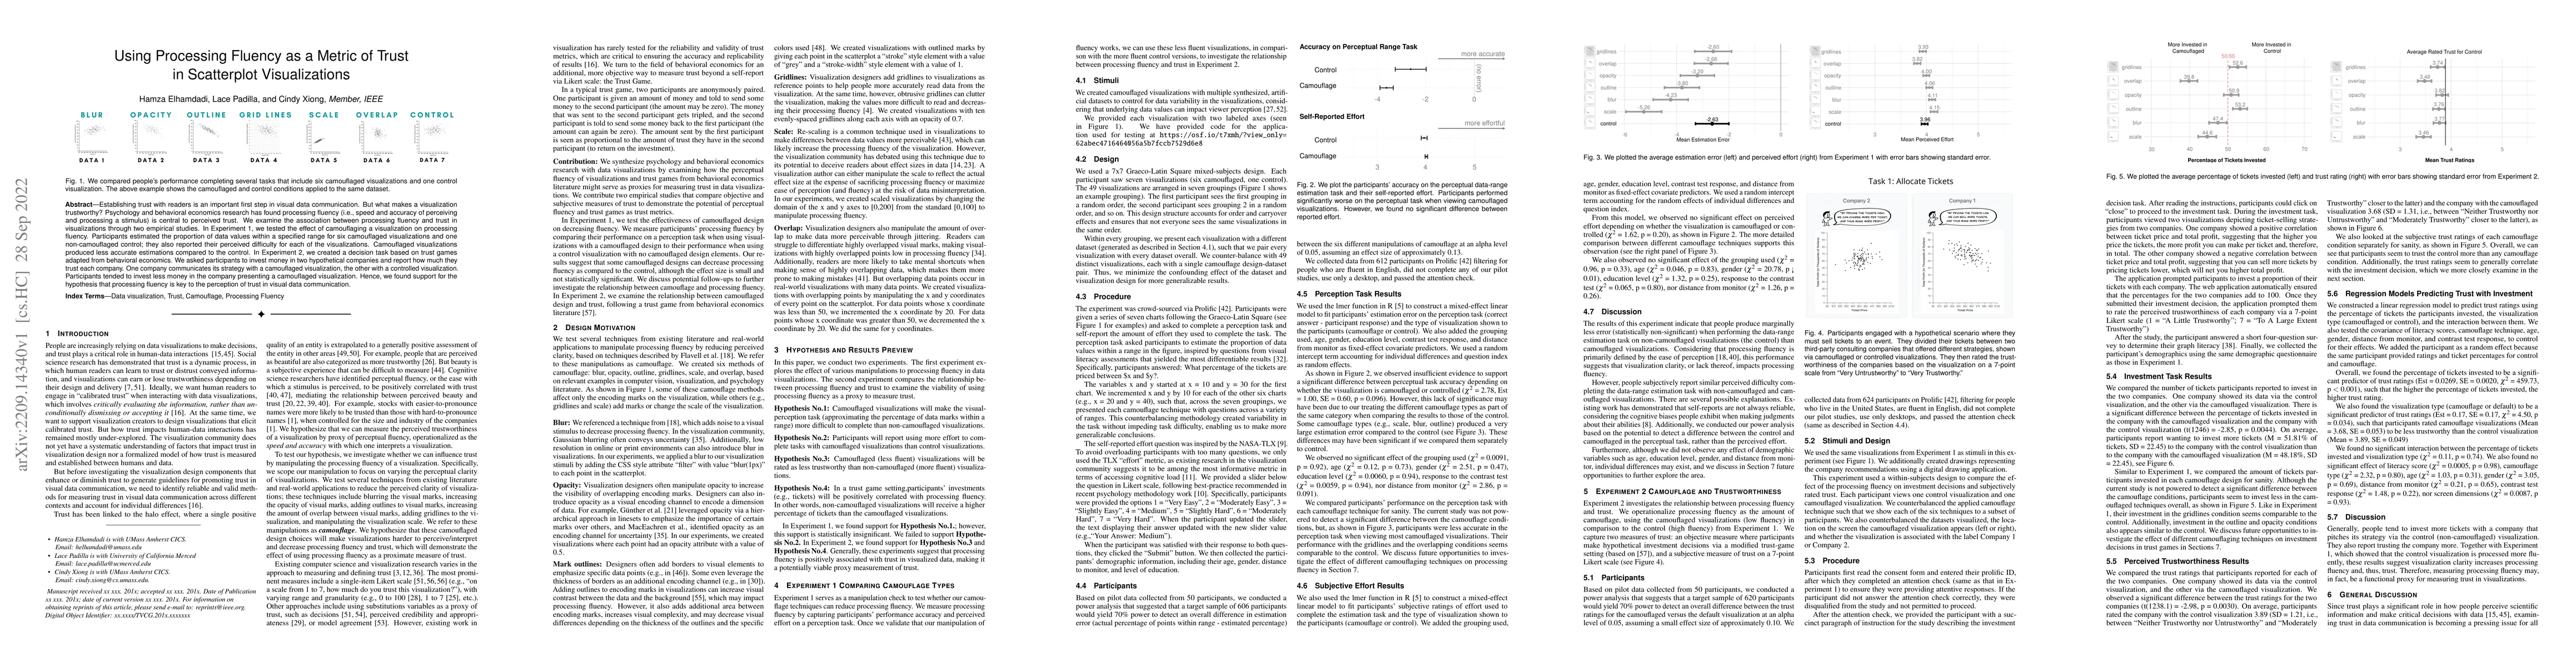
Establishing trust with readers is an important first step in visual data communication. But what makes a visualization trustworthy? Psychology and behavioral economics research has found processing fluency (i.e., speed and accuracy of perceiving and processing a stimulus) is central to perceived trust. We examine the association between processing fluency and trust in visualizations through two empirical studies. In Experiment 1, we tested the effect of camouflaging a visualization on processing fluency. Participants estimated the proportion of data values within a specified range for six camouflaged visualizations and one non-camouflaged control; they also reported their perceived difficulty for each of the visualizations. Camouflaged visualizations produced less accurate estimations compared to the control. In Experiment 2, we created a decision task based on trust games adapted from behavioral economics. We asked participants to invest money in two hypothetical companies and report how much they trust each company. One company communicates its strategy with a camouflaged visualization, the other with a controlled visualization. Participants tended to invest less money in the company presenting a camouflaged visualization. Hence, we found support for the hypothesis that processing fluency is key to the perception of trust in visual data communication.
AI Key Findings
Get AI-generated insights about this paper's methodology, results, significance, and more — seven facets brought into focus.
Impact
Paper Details
Authors
PDF Preview
Key Terms
Citation Network
Current paper (gray), citations (green), references (blue)
Display is limited for performance on very large graphs.
Discussion 0