VARENN: Graphical representation of spatiotemporal data and application to climate studies
Publication
Metrics
AI Quick Summary
VARENN visually represents spatiotemporal climate data from 1901-2016 into 2D images, enabling efficient analysis of monthly observations. The method uses color channels to depict multiple variables and trains convolutional neural networks to classify climate trends, demonstrating significant model accuracy influenced by input variable similarities.
Paper Preview
Abstract
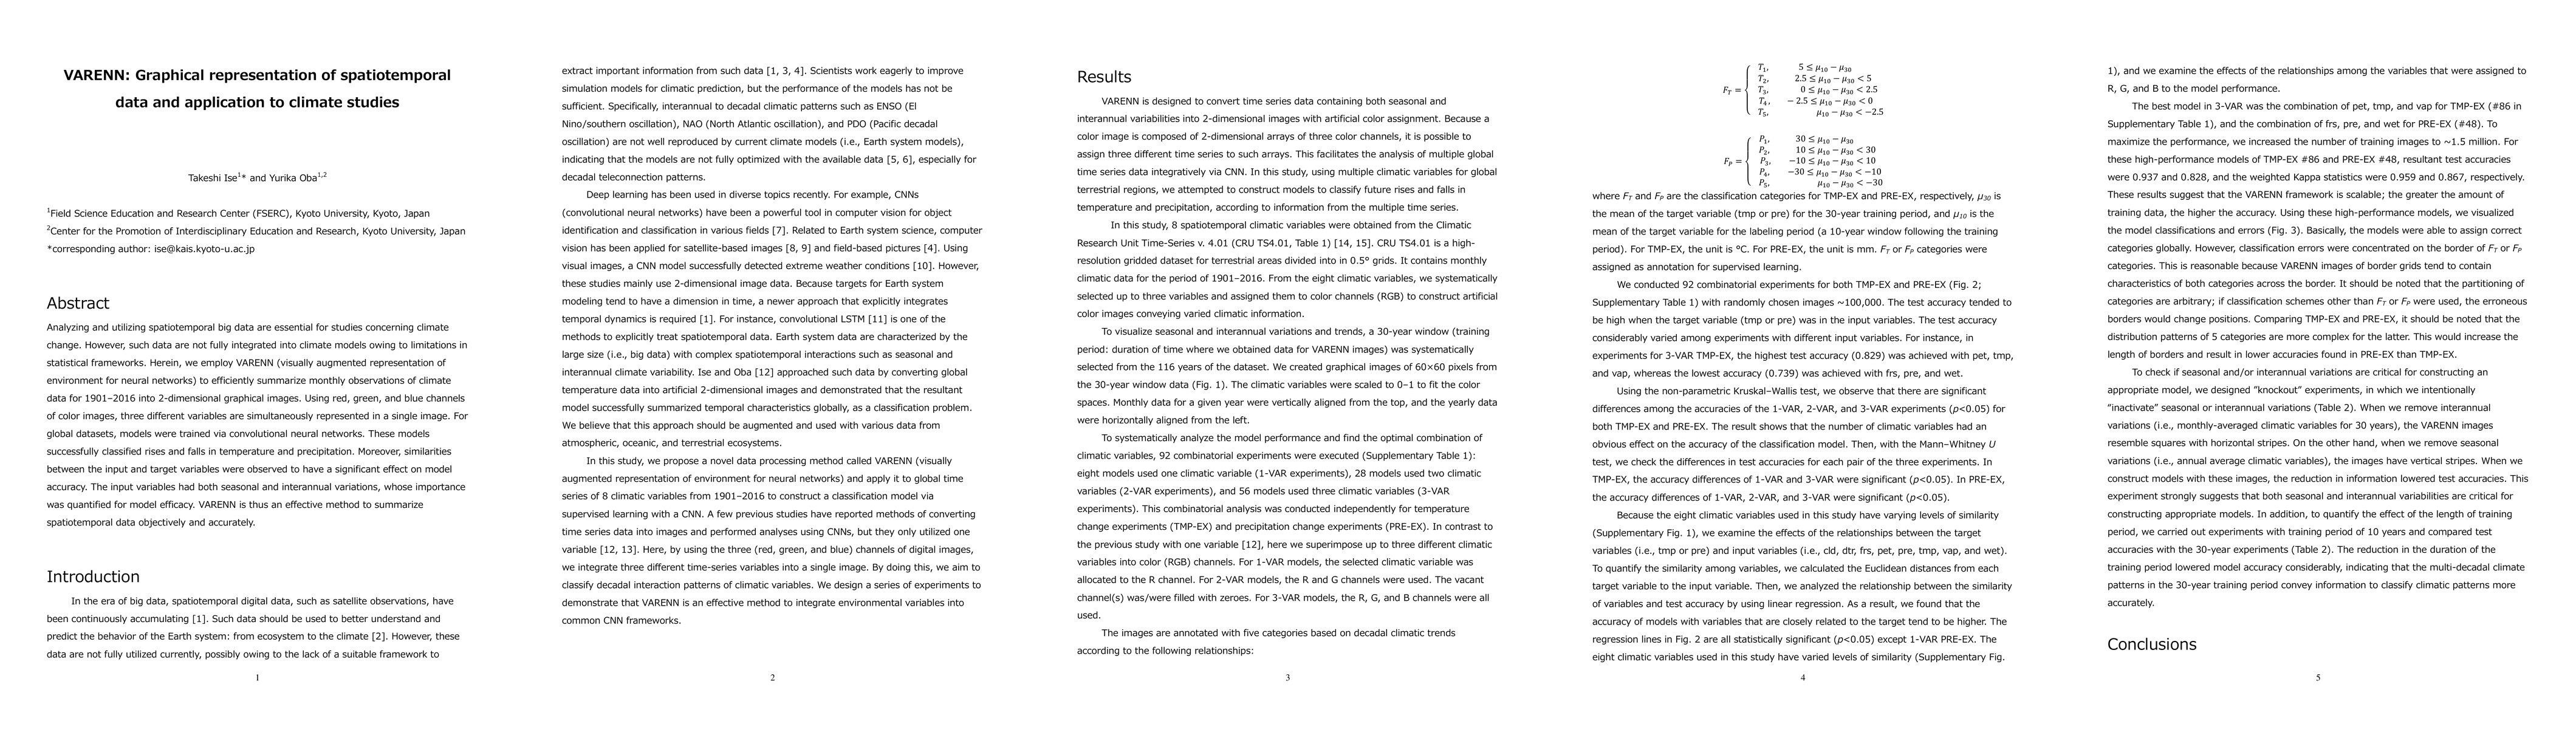
Analyzing and utilizing spatiotemporal big data are essential for studies concerning climate change. However, such data are not fully integrated into climate models owing to limitations in statistical frameworks. Herein, we employ VARENN (visually augmented representation of environment for neural networks) to efficiently summarize monthly observations of climate data for 1901-2016 into 2-dimensional graphical images. Using red, green, and blue channels of color images, three different variables are simultaneously represented in a single image. For global datasets, models were trained via convolutional neural networks. These models successfully classified rises and falls in temperature and precipitation. Moreover, similarities between the input and target variables were observed to have a significant effect on model accuracy. The input variables had both seasonal and interannual variations, whose importance was quantified for model efficacy. VARENN is thus an effective method to summarize spatiotemporal data objectively and accurately.
AI Key Findings
Get AI-generated insights about this paper's methodology, results, significance, and more — seven facets brought into focus.
Impact
Paper Details
PDF Preview
Key Terms
Citation Network
Current paper (gray), citations (green), references (blue)
Display is limited for performance on very large graphs.
Discussion 0