A Survey on Exploratory Spatiotemporal Visual Analytics Approaches for Climate Science
Publication
Metrics
AI Quick Summary
This paper offers a comprehensive survey of exploratory spatiotemporal visual analytics techniques for climate science, categorizing current approaches based on various factors including task requirements and visualization methods. It identifies trends, limitations, and key challenges, aiming to guide future research and help scientists better understand and mitigate climate change.
Paper Preview
Abstract
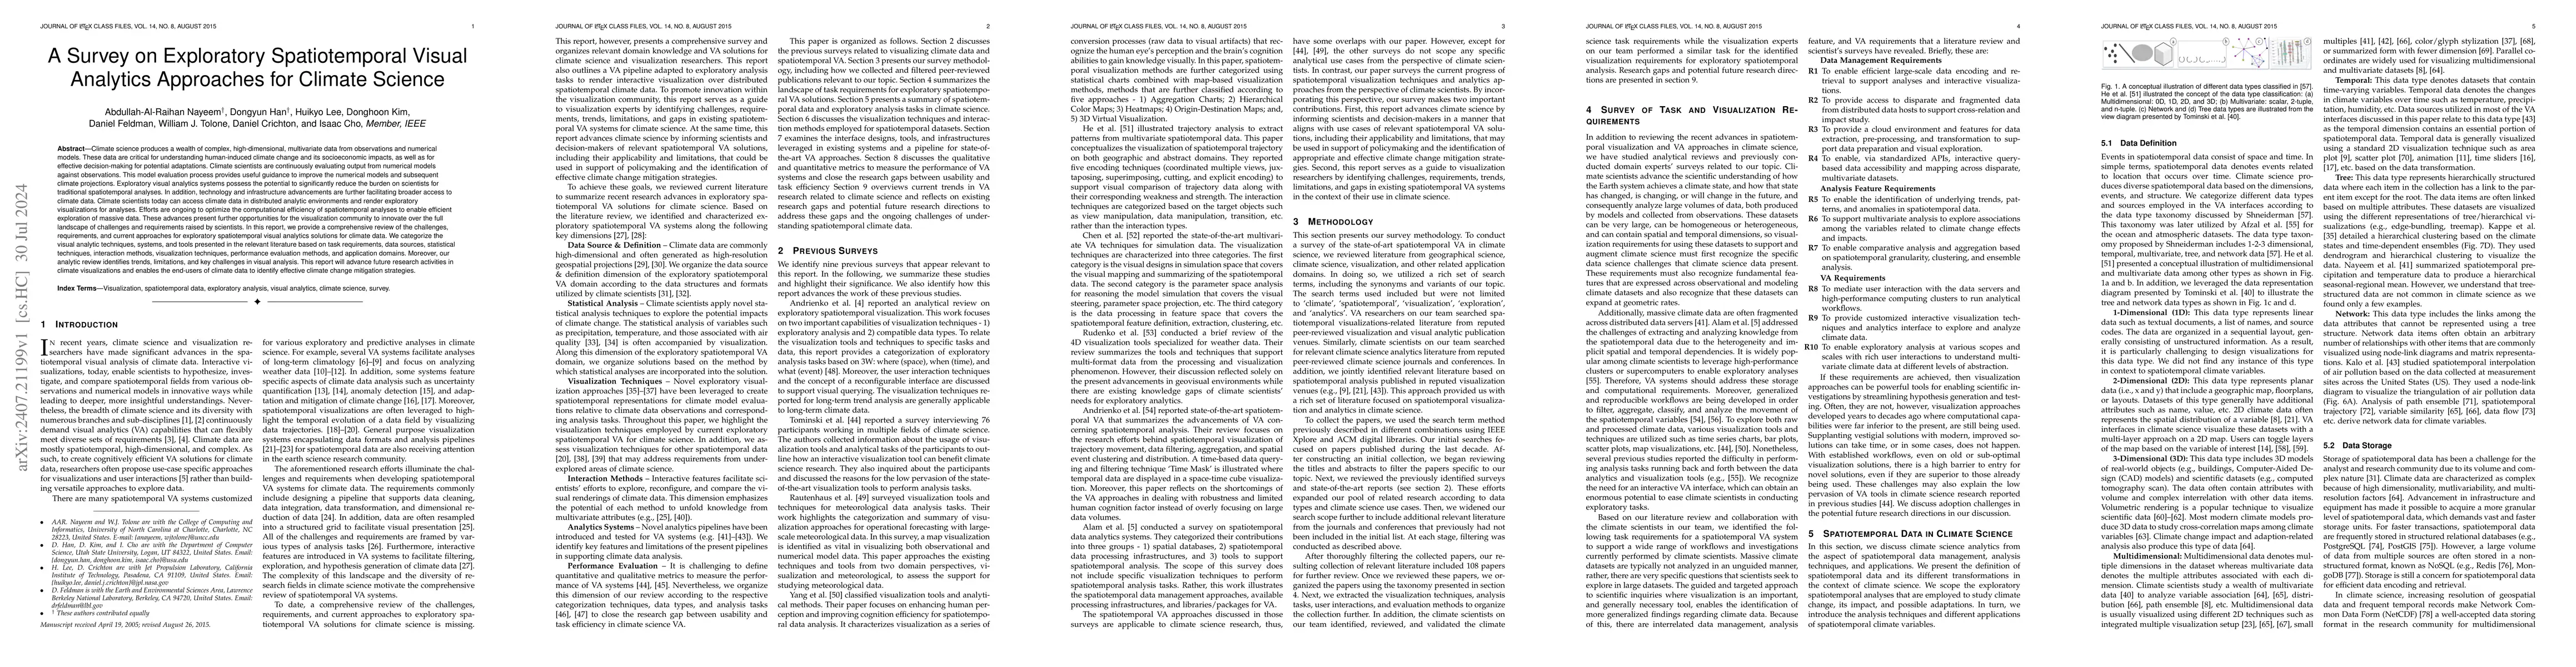
Climate science produces a wealth of complex, high-dimensional, multivariate data from observations and numerical models. These data are critical for understanding climate changes and their socioeconomic impacts. Climate scientists are continuously evaluating output from numerical models against observations. This model evaluation process provides useful guidance to improve the numerical models and subsequent climate projections. Exploratory visual analytics systems possess the potential to significantly reduce the burden on scientists for traditional spatiotemporal analyses. In addition, technology and infrastructure advancements are further facilitating broader access to climate data. Climate scientists today can access climate data in distributed analytic environments and render exploratory visualizations for analyses. Efforts are ongoing to optimize the computational efficiency of spatiotemporal analyses to enable efficient exploration of massive data. These advances present further opportunities for the visualization community to innovate over the full landscape of challenges and requirements raised by scientists. In this report, we provide a comprehensive review of the challenges, requirements, and current approaches for exploratory spatiotemporal visual analytics solutions for climate data. We categorize the visual analytic techniques, systems, and tools presented in the relevant literature based on task requirements, data sources, statistical techniques, interaction methods, visualization techniques, performance evaluation methods, and application domains. Moreover, our analytic review identifies trends, limitations, and key challenges in visual analysis. This report will advance future research activities in climate visualizations and enables the end-users of climate data to identify effective climate change mitigation strategies.
AI Key Findings
Get AI-generated insights about this paper's methodology, results, significance, and more — seven facets brought into focus.
Impact
Authors
PDF Preview
Citation Network
Current paper (gray), citations (green), references (blue)
Display is limited for performance on very large graphs.
Discussion 0