Academic Profile
Statistics
Similar Authors
Papers on arXiv
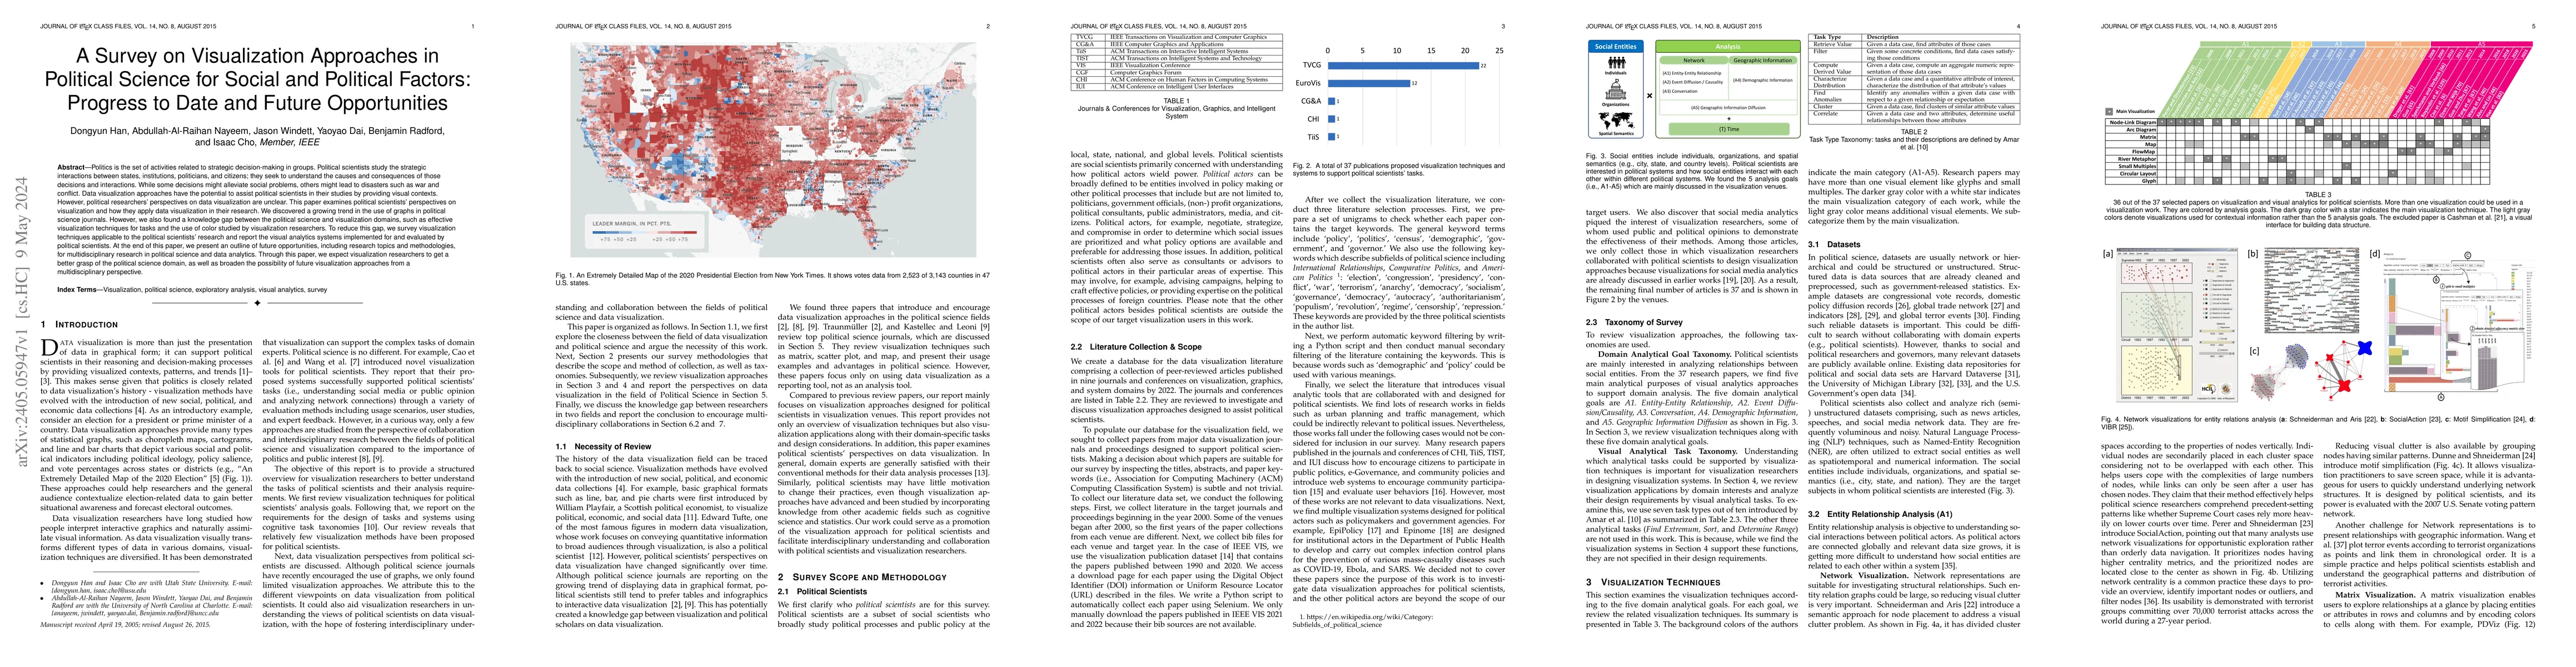
Politics is the set of activities related to strategic decision-making in groups. Political scientists study the strategic interactions between states, institutions, politicians, and citizens; they ...
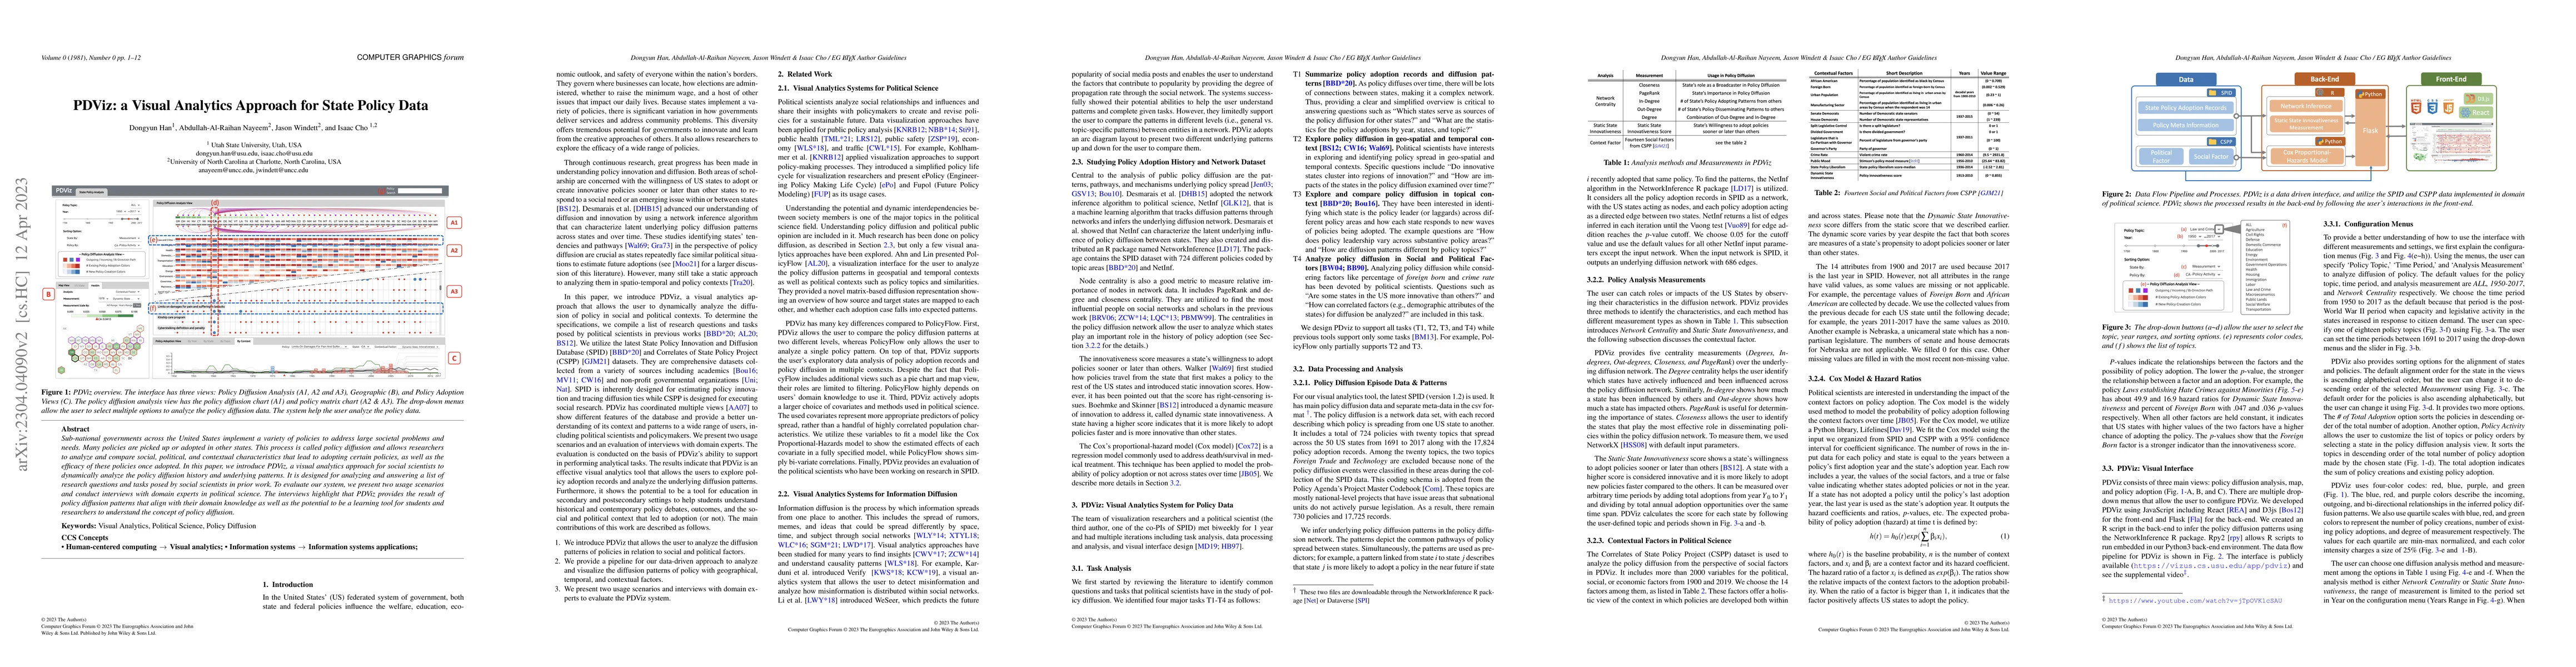
Sub-national governments across the United States implement a variety of policies to address large societal problems and needs. Many policies are picked up or adopted in other states. This process i...
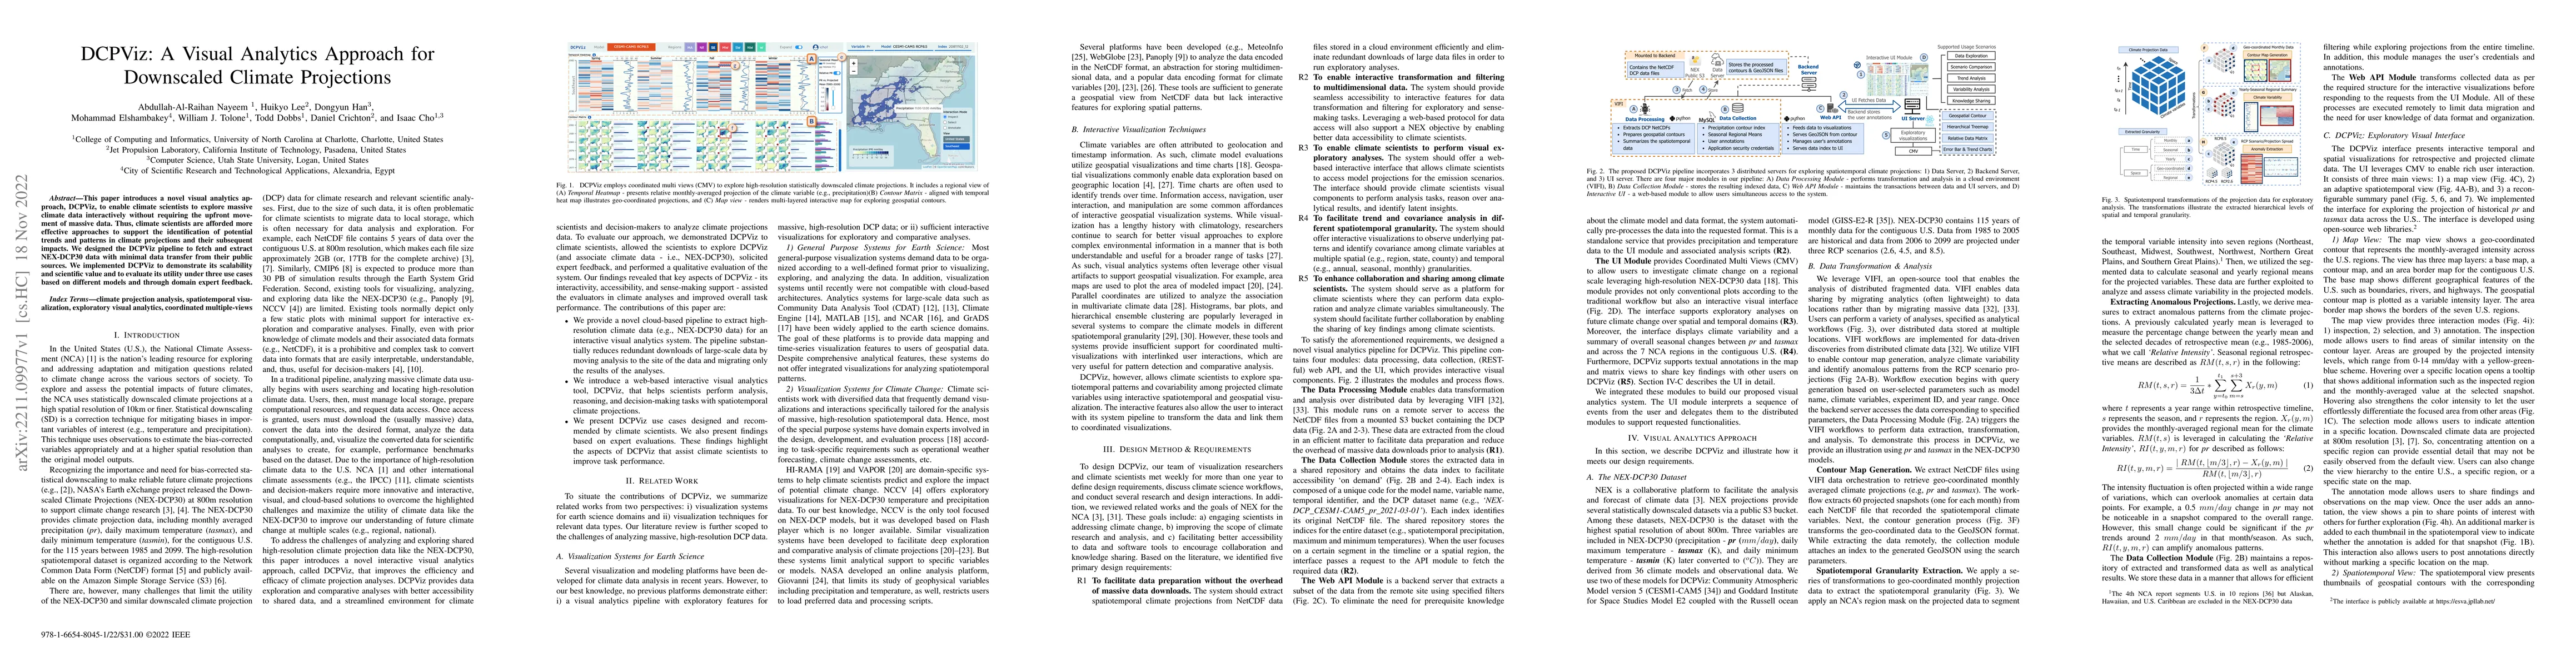
This paper introduces a novel visual analytics approach, DCPViz, to enable climate scientists to explore massive climate data interactively without requiring the upfront movement of massive data. Th...
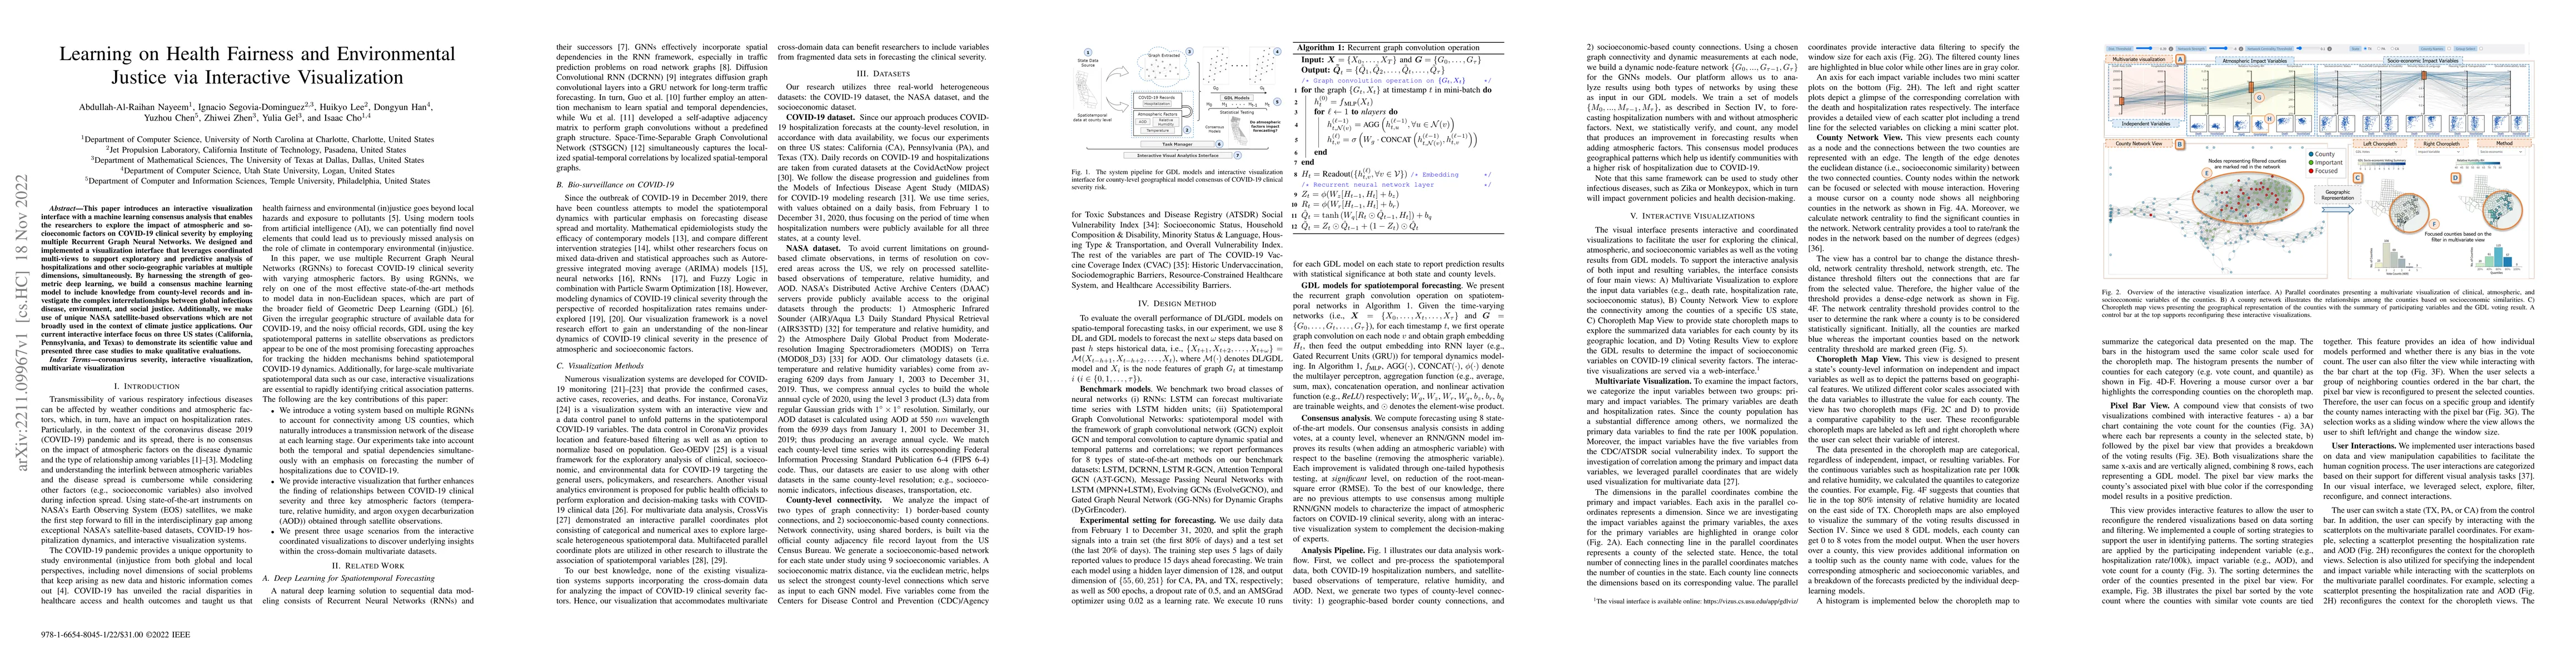
This paper introduces an interactive visualization interface with a machine learning consensus analysis that enables the researchers to explore the impact of atmospheric and socioeconomic factors on...
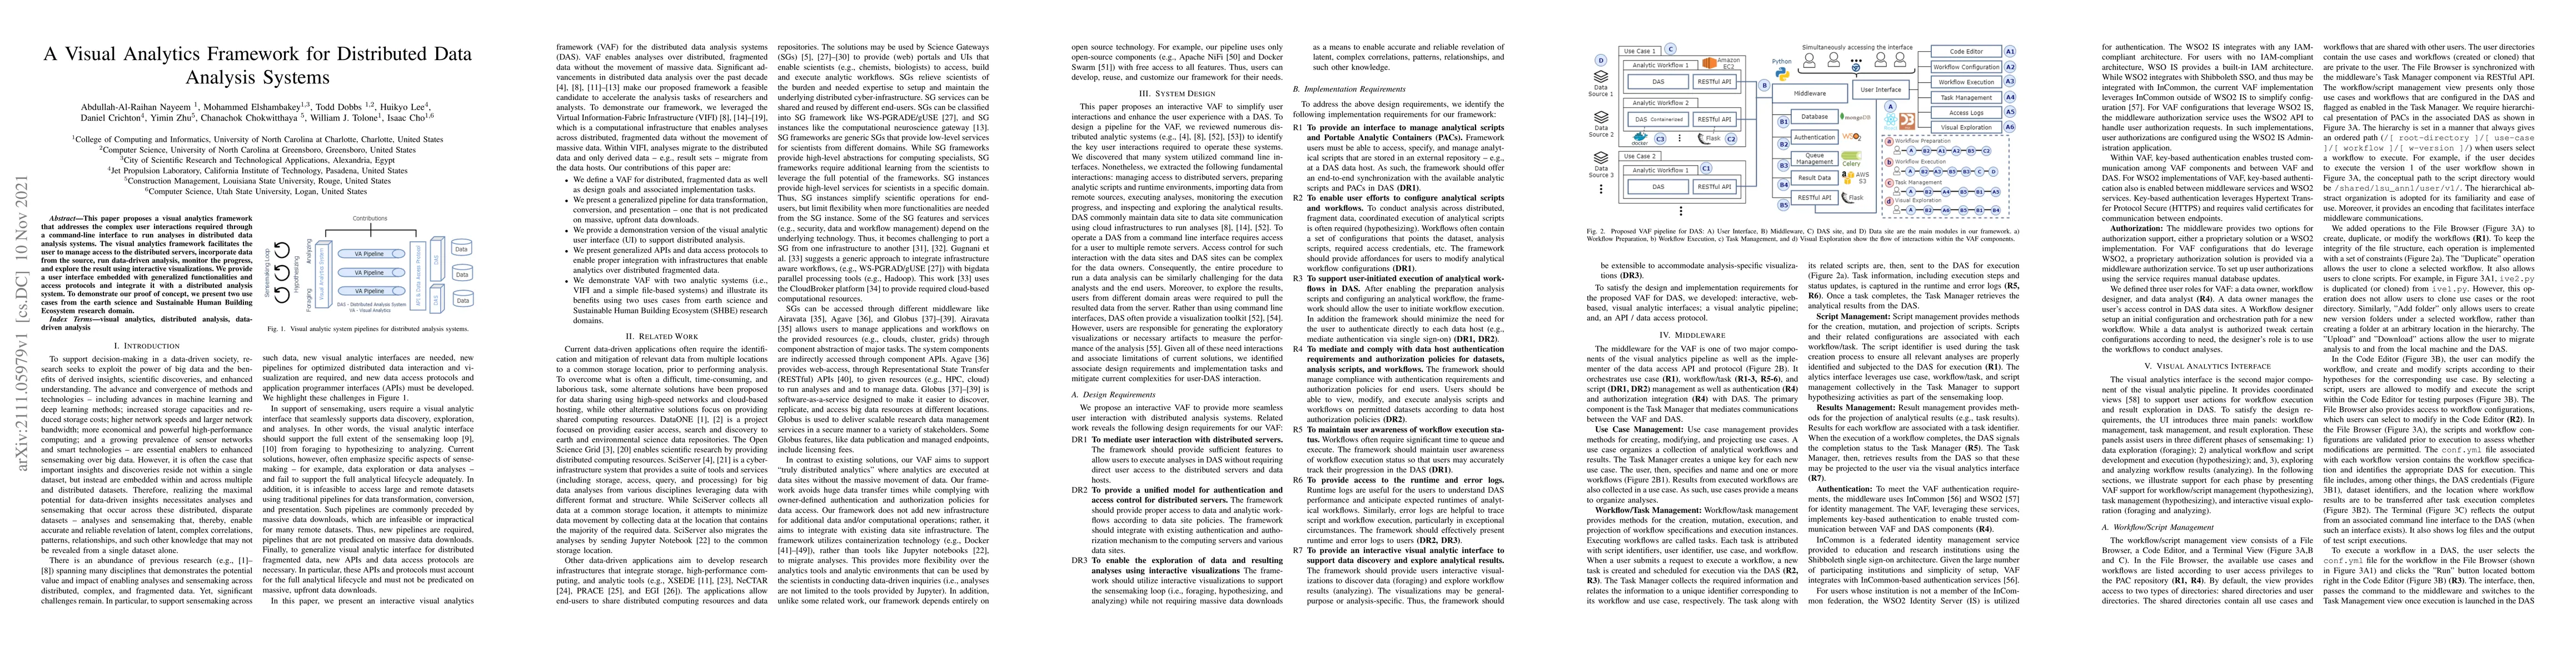
This paper proposes a visual analytics framework that addresses the complex user interactions required through a command-line interface to run analyses in distributed data analysis systems. The visu...
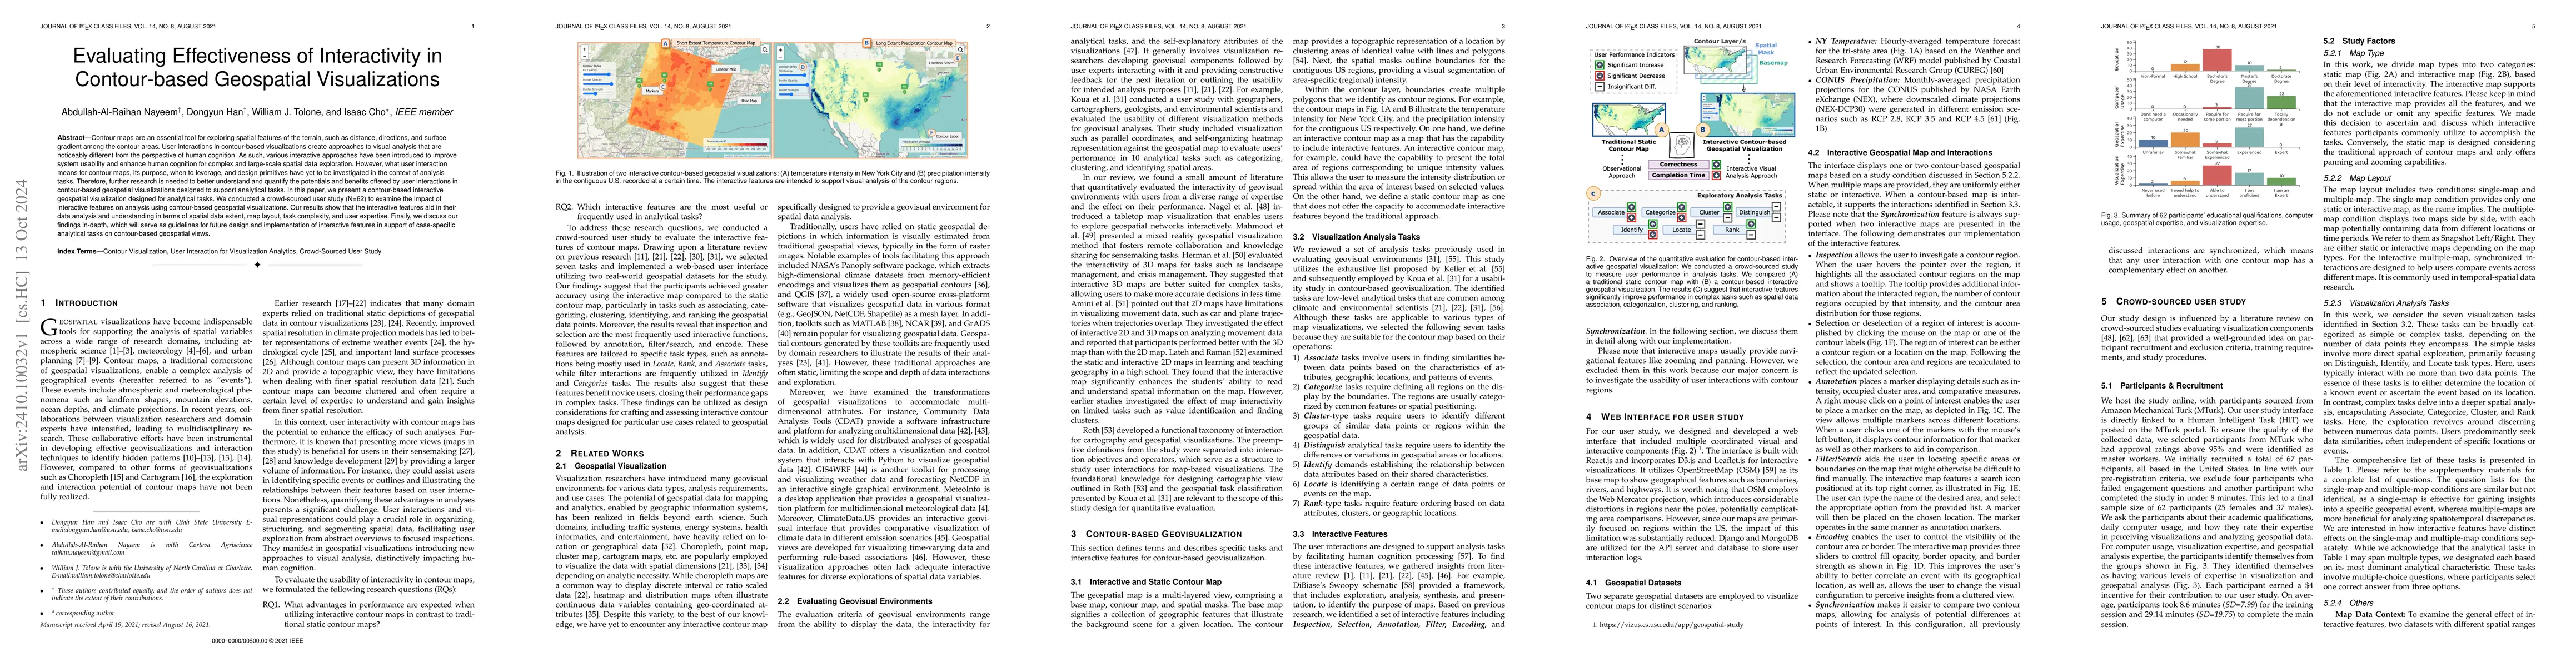
Contour maps are an essential tool for exploring spatial features of the terrain, such as distance, directions, and surface gradient among the contour areas. User interactions in contour-based visuali...
Climate science produces a wealth of complex, high-dimensional, multivariate data from observations and numerical models. These data are critical for understanding climate changes and their socioecono...