DCPViz: A Visual Analytics Approach for Downscaled Climate Projections
Publication
Metrics
AI Quick Summary
DCPViz is a visual analytics tool designed to interactively explore massive climate data without requiring data transfer, aiding in the identification of trends and patterns in climate projections. The tool was evaluated through three use cases and received positive feedback from domain experts.
Paper Preview
Abstract
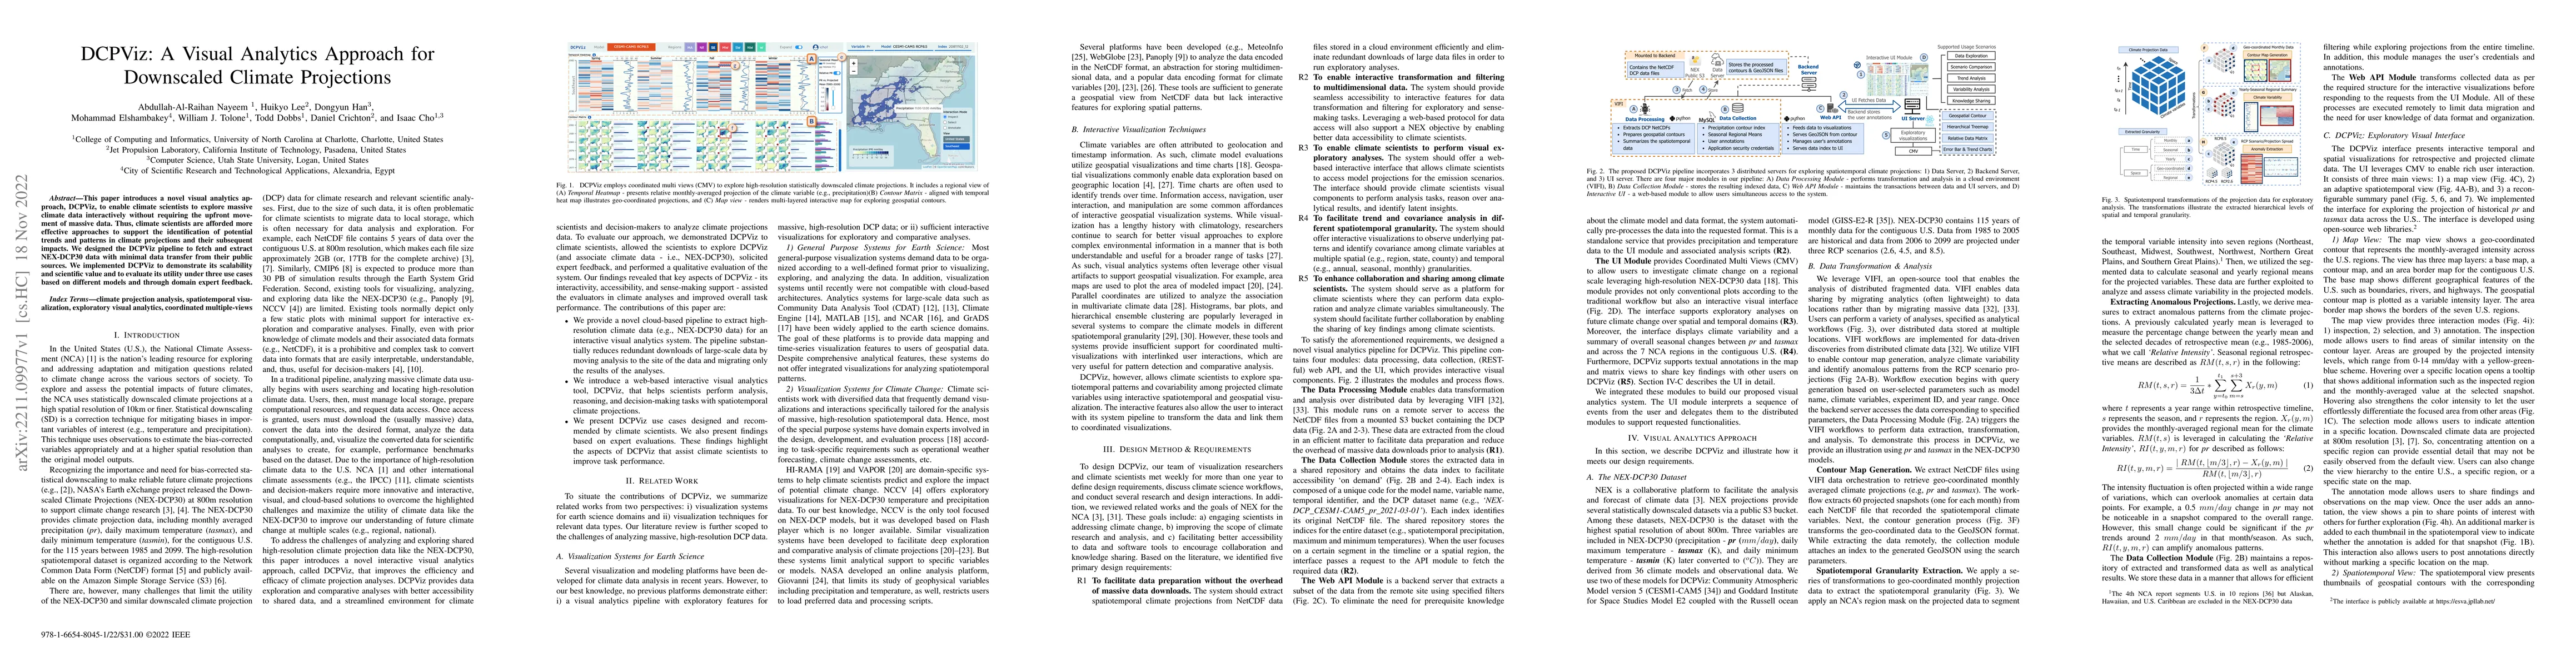
This paper introduces a novel visual analytics approach, DCPViz, to enable climate scientists to explore massive climate data interactively without requiring the upfront movement of massive data. Thus, climate scientists are afforded more effective approaches to support the identification of potential trends and patterns in climate projections and their subsequent impacts. We designed the DCPViz pipeline to fetch and extract NEX-DCP30 data with minimal data transfer from their public sources. We implemented DCPViz to demonstrate its scalability and scientific value and to evaluate its utility under three use cases based on different models and through domain expert feedback.
AI Key Findings
Get AI-generated insights about this paper's methodology, results, significance, and more — seven facets brought into focus.
Impact
Paper Details
Authors
PDF Preview
Key Terms
Citation Network
Current paper (gray), citations (green), references (blue)
Display is limited for performance on very large graphs.
Discussion 0