This paper evaluates the effectiveness of interactivity in contour-based geospatial visualizations for analytical tasks, revealing that interactive features significantly aid in data analysis and understanding. The study highlights the benefits of interactivity in terms of spatial data extent, map layout, task complexity, and user expertise.
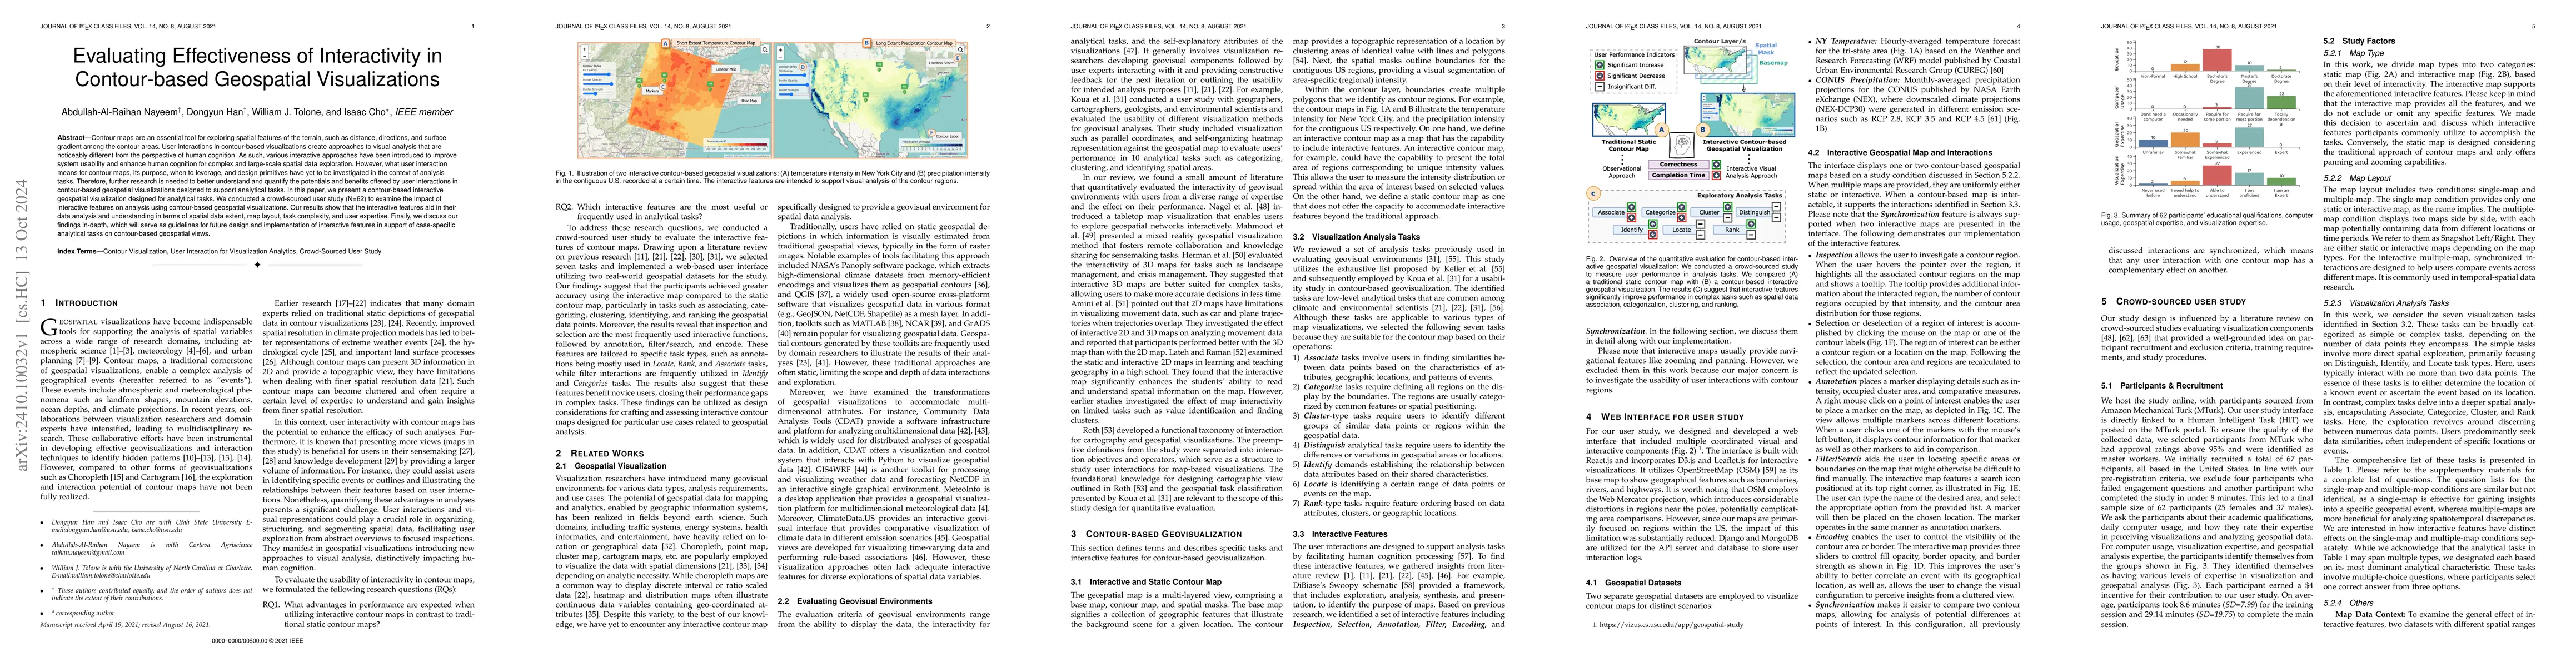
Contour maps are an essential tool for exploring spatial features of the terrain, such as distance, directions, and surface gradient among the contour areas. User interactions in contour-based visualizations create approaches to visual analysis that are noticeably different from the perspective of human cognition. As such, various interactive approaches have been introduced to improve system usability and enhance human cognition for complex and large-scale spatial data exploration. However, what user interaction means for contour maps, its purpose, when to leverage, and design primitives have yet to be investigated in the context of analysis tasks. Therefore, further research is needed to better understand and quantify the potentials and benefits offered by user interactions in contour-based geospatial visualizations designed to support analytical tasks. In this paper, we present a contour-based interactive geospatial visualization designed for analytical tasks. We conducted a crowd-sourced user study (N=62) to examine the impact of interactive features on analysis using contour-based geospatial visualizations. Our results show that the interactive features aid in their data analysis and understanding in terms of spatial data extent, map layout, task complexity, and user expertise. Finally, we discuss our findings in-depth, which will serve as guidelines for future design and implementation of interactive features in support of case-specific analytical tasks on contour-based geospatial views.
Get AI-generated insights about this paper's methodology, results, and significance.
Current paper (gray), citations (green), references (blue)
Olga Russakovsky, Sunnie S. Y. Kim, Amna Liaqat et al.
Yu Zhang, Guozheng Li, Xinyue Chen et al.
Shushman Choudhury, Abdul Rahman Kreidieh, Iveel Tsogsuren et al.
Kevin Roitero, Stefano Mizzaro, Stef De Sabbata
No citations found for this paper.
Title | Authors | Year | Actions |
---|---|---|---|
Learning on Health Fairness and Environmental Justice via Interactive Visualization
|
A. Nayeem, I. Segovia-Dominguez, Huikyo Lee, Dongyun Han, Yuzhou Chen, Zhiwei Zhen, Y. Gel, Isaac Cho
|
2022
|
View Paper |
DCPViz: A Visual Analytics Approach for Downscaled Climate Projections
|
A. Nayeem, Huikyo Lee, Dongyun Han, Mohammed Elshambakey, William J. Tolone, Todd Dobbs, D. Crichton, Isaac Cho
|
2022
|
View Paper |
A Visual Analytics Framework for Distributed Data Analysis Systems
|
A. Nayeem, Mohammed Elshambakey, Todd Dobbs, Huikyo Lee, D. Crichton, Yimin Zhu, Chanachok Chokwitthaya, William J. Tolone, Isaac Cho
|
2021
|
View Paper |
Toward flexible visual analytics augmented through smooth display transitions
|
C. Tominski, G. Andrienko, N. Andrienko, S. Bleisch, S. Fabrikant, E. Mayr, S. Miksch, M. Pohl, A. Skupin
|
2021
|
View Paper |
EMPLOYING DEEP LEARNING TO ENABLE VISUAL EXPLORATION OF EARTH SCIENCE EVENTS
|
M. Maskey, R. Ramachandran, I. Gurung, Muthukumaran Ramasubramanian, B. Freitag, A. Kaulfus, G. Priftis, Drew Bollinger, Ricardo Mestre, Daniel da Silva
|
2020
|
View Paper |
A Bayesian cognition approach for belief updating of correlation judgement through uncertainty visualizations
|
Alireza Karduni, D. Markant, Ryan Wesslen, Wenwen Dou
|
2020
|
View Paper |
Topology Density Map for Urban Data Visualization and Analysis
|
Zezheng Feng, Haotian Li, Wei Zeng, Shuang-Hua Yang, Huamin Qu
|
2020
|
View Paper |
Why Ordinal Variables Can (Almost) Always Be Treated as Continuous Variables: Clarifying Assumptions of Robust Continuous and Ordinal Factor Analysis Estimation Methods
|
A. Robitzsch
|
2020
|
View Paper |
The Hawai‘i Rainfall Analysis and Mapping Application (HI-RAMA): Decision Support and Data Visualization for Statewide Rainfall Data
|
Jared H. McLean, S. Cleveland, M. Lucas, Ryan J. Longman, T. Giambelluca, J. Leigh, G. Jacobs
|
2020
|
View Paper |
Spatio-temporal visual analytics: a vision for 2020s
|
N. Andrienko, G. Andrienko
|
2020
|
View Paper |
CrossVis: A visual analytics system for exploring heterogeneous multivariate data with applications to materials and climate sciences
|
C. Steed, J. Goodall, Junghoon Chae, A. Trofimov
|
2020
|
View Paper |
Comparison of Diurnal Variation of Land Surface Temperature From GOES-16 ABI and MODIS Instruments
|
C. Beale, H. Norouzi, Zahra Sharifnezhadazizi, A. Bah, P. Yu, Yunyue Yu, R. Blake, A. Vaçulik, J. Gonzalez-Cruz
|
2020
|
View Paper |
Urban Structure Accessibility Modeling and Visualization for Joint Spatiotemporal Constraints
|
Farah Kamw, Shamal Al-Dohuki, Ye Zhao, Thomas Eynon, David A. Sheets, Jing Yang, X. Ye, Wei Chen
|
2020
|
View Paper |
Improving Information Sharing and Collaborative Analysis for Remote GeoSpatial Visualization Using Mixed Reality
|
Tahir Mahmood, William R. Fulmer, Neelesh Mungoli, Jian Huang, Aidong Lu
|
2019
|
View Paper |
Usage Patterns of Wideband Display Environments In e-Science Research, Development and Training
|
J. Leigh, Krishna Bharadwaj, Arthur Nishimoto, Lance Long, J. Haga, John Burns, F. Cristobal, Jared H. McLean, Roberto Pelayo, Mahdi Belcaid, Dylan Kobayashi, Nurit Kirshenbaum, Troy Wooton, Alberto Gonzalez, L. Renambot, Andrew E. Johnson, Maxine D. Brown, A. Burks
|
2019
|
View Paper |
A Survey of Multi-Space Techniques in Spatio-Temporal Simulation Data Visualization
|
Xueyi Chen, Liming Shen, Ziqi Sha, Richen Liu, Siming Chen, G. Ji, Chao Tan
|
2019
|
View Paper |
An Open Source Software Suite for Multi-Dimensional Meteorological Data Computation and Visualisation
|
Y. Wang
|
2019
|
View Paper |
The State of the Art in Visual Analysis Approaches for Ocean and Atmospheric Datasets
|
S. Afzal, M. Hittawe, Sohaib Ghani, T. Jamil, O. Knio, Markus Hadwiger, K. Ho
|
2019
|
View Paper |
SOVAS: a scalable online visual analytic system for big climate data analysis
|
Zhenlong Li, Qunying Huang, Yuqin Jiang, F. Hu
|
2019
|
View Paper |
Open source QGIS toolkit for the Advanced Research WRF modelling system
|
D. Meyer, M. Riechert
|
2019
|
View Paper |
The Advantages of Synergy-Quantitative Earth Science Data Visualization and Analysis with Giovanni, Panoply, and Excel
|
J. Acker, G. Alcott, M. Ventura, Jennifer C. Wei, D. Meyer
|
2018
|
View Paper |
WebGIobe - A cloud-based geospatial analysis framework for interacting with climate data
|
Arun Sharma, S. M. A. Zaidi, V. Chandola, M. Allen, B. Bhaduri
|
2018
|
View Paper |
Evaluation of User Performance in Interactive and Static 3D Maps
|
L. Herman, Vojtěch Juřík, Z. Stachoň, D. Vrbík, Jan Russnák, T. Řezník
|
2018
|
View Paper |
Association Rules-Based Multivariate Analysis and Visualization of Spatiotemporal Climate Data
|
Feng Wang, Wenwen Li, Sizhe Wang, Chris R. Johnson
|
2018
|
View Paper |
Non‐normal data: Is ANOVA still a valid option?
|
M. Blanca, R. Alarcón, J. Arnau, Roser Bono, R. Bendayan
|
2017
|
View Paper |
Evaluating hourly rainfall characteristics over the U.S. Great Plains in dynamically downscaled climate model simulations using NASA‐Unified WRF
|
Huikyo Lee, D. Waliser, R. Ferraro, T. Iguchi, C. Peters-Lidard, B. Tian, P. Loikith, D. Wright
|
2017
|
View Paper |
The State‐of‐the‐Art in Predictive Visual Analytics
|
Yafeng Lu, Rolando Garcia, Brett Hansen, Michael Gleicher, Ross Maciejewski
|
2017
|
View Paper |
Design and evaluation of a geovisual analytics system for uncovering patterns in spatio-temporal event data
|
A. Robinson, D. Peuquet, Scott Pezanowski, F. Hardisty, Brian Swedberg
|
2017
|
View Paper |
On the use of self‐organizing maps for studying climate extremes
|
P. Gibson, S. Perkins‐Kirkpatrick, P. Uotila, A. Pepler, L. Alexander
|
2017
|
View Paper |
Communicating Local Climate Risks Online Through an Interactive Data Visualization
|
J. Herring, Matthew S. VanDyke, R. Cummins, F. Melton
|
2017
|
View Paper |
The State of the Art in Cartograms
|
S. Nusrat, S. Kobourov
|
2016
|
View Paper |
Visually Comparing Weather Features in Forecasts
|
Miriah D. Meyer, M. Goodchild, Steve Kruger, J. Dykes
|
2016
|
View Paper |
NASA Earth Exchange (NEX) Supporting Analyses for National Climate Assessments
|
R. Nemani, B. Thrasher, Weile Wang, Tsengdar J. Lee, F. Melton, J. Dungan, A. Michaelis
|
2015
|
View Paper |
Web based visualization of large climate data sets
|
J. Alder, S. Hostetler
|
2015
|
View Paper |
Visualizing Mobility of Public Transportation System
|
Wei Zeng, Chi-Wing Fu, S. Arisona, A. Erath, Huamin Qu
|
2014
|
View Paper |
Potential for added value to downscaled climate extremes over Korea by increased resolution of a regional climate model
|
Ji-Woo Lee, Song‐You Hong
|
2014
|
View Paper |
MeteoInfo: GIS software for meteorological data visualization and analysis
|
Y. Wang
|
2014
|
View Paper |
An Empirically-Derived Taxonomy of Interaction Primitives for Interactive Cartography and Geovisualization
|
R. Roth
|
2013
|
View Paper |
Large high resolution displays for co-located collaborative sensemaking: Display usage and territoriality
|
Lauren Bradel, A. Endert, Kristen Koch, Christopher Andrews, Chris North
|
2013
|
View Paper |
Dynamic downscaling of 22-year CFS winter seasonal hindcasts with the UCLA-ETA regional climate model over the United States
|
F. Sales, Y. Xue
|
2013
|
View Paper |
Interactive exploration of geospatial network visualization
|
T. Nagel, E. Duval, A. Moere
|
2012
|
View Paper |
Information Visualization in Climate Research
|
C. Tominski, J. Donges, T. Nocke
|
2011
|
View Paper |
Evaluating Climate Visualization: An Information Visualization Approach
|
J. Johansson, T. Neset, Björn‐Ola Linnér
|
2010
|
View Paper |
Crowdsourcing graphical perception: using mechanical turk to assess visualization design
|
Jeffrey Heer, M. Bostock
|
2010
|
View Paper |
Space to think: large high-resolution displays for sensemaking
|
Christopher Andrews, A. Endert, Chris North
|
2010
|
View Paper |
Visualization of uncertainty and ensemble data: Exploration of climate modeling and weather forecast data with integrated ViSUS-CDAT systems
|
Kristin C. Potter, Andrew T. Wilson, P. Bremer, Dean N. Williams, C. Doutriaux, Valerio Pascucci, Chris Johhson
|
2009
|
View Paper |
Addressing Map Interface Usability: Learning from the Lakeshore Nature Preserve Interactive Map
|
R. Roth, Mark Harrower
|
2008
|
View Paper |
Geovisual analytics for spatial decision support: Setting the research agenda
|
G. Andrienko, N. Andrienko, Piotr Jankowski, Daniel A. Keim, M. Kraak, A. Maceachren, Stefan Wrobel
|
2007
|
View Paper |
Evaluating the usability of visualization methods in an exploratory geovisualization environment
|
Etien L. Koua, A. Maceachren, M. Kraak
|
2006
|
View Paper |
A study on the use of interactive web-based maps in the learning and teaching of geography
|
H. Lateh, A. Raman
|
2005
|
View Paper |
The Power of Place
|
Richard Whatmore
|
2002
|
View Paper |
Defining visualization operations for temporal cartographic animation design
|
P. Ogao, M. J. Kraak
|
2002
|
View Paper |
The GrADS Project: Software Support for High-Level Grid Application Development
|
F. Berman, A. Chien, K. Cooper, J. Dongarra, Ian T Foster, Dennis Gannon, S. Johnsson, K. Kennedy, C. Kesselman, J. Mellor-Crummey, D. Reed, Linda Torczon, R. Wolski
|
2001
|
View Paper |
Visual cues - practical data visualization
|
Peter R. Keller, Marylin M. Keller
|
1993
|
View Paper |
Contour Line Stylization to Visualize Multivariate Information
|
Gazi Md. Hasnat Zahan, Debajyoti Mondal, C. Gutwin
|
2021
|
View Paper |
“Spatiotem-poral variations of global terrestrial vegetation climate potential productivity under climate change,”
|
2021
|
||
Mastering Matlab 5 A Comprehensive Tutorial And Reference
|
K. Rothschild
|
2016
|
View Paper |
The Impact of Interactivity on Comprehending 2D and 3D Visualizations of Movement Data
|
Fereshteh Amini, Sébastien Rufiange, Zahid Hossain, Quentin Ventura, Pourang Irani, Michael J. McGuffin
|
2015
|
View Paper |
“What is in a contour map?”
|
2015
|
||
OpenStreetMap
|
K. Curran, J. Crumlish, Gavin Fisher
|
2012
|
View Paper |
NCAR Command Language (NCL)
|
David Brown, R. Brownrigg, Mary Haley, Wei Huang
|
2012
|
View Paper |
CHOROPLETH MAPS: CLASSIFICATION REVISITED
|
N. Andrienko, Alexandr A. Savinov
|
2012
|
View Paper |
“Climate data analysis tool: An open software system approach,”
|
2002
|
||
“Visualization in the earth sciences,”
|
1990
|
||
University of the North.
|
J. Boshoff
|
1971
|
View Paper |
Locate is identifying a certain range of data points or events on the map
|
|||
Identify demands establishing the relationship between data attributes based on their shared characteristics
|
|||
Dongyun
|
|||
Categorize tasks require defining all regions on the display by the boundaries
|
|||
Cluster -type tasks require users to identify different groups of similar data points or regions within the geospatial data
|
|||
Associate tasks involve users in finding similarities be-tween data points based on the characteristics of attributes, geographic locations, and patterns of events
|
|||
Department at Utah State University
|
|||
Distinguish analytical tasks require users to identify the differences or variations in geospatial areas or locations
|
Showing first page preview. Click "Open Full PDF" to view the complete paper.
Your comment contains inappropriate language and has been rejected.
Are you sure you want to remove this tag? This action cannot be undone.
Someone just favorited a paper!
Comments (0)