Publication
Metrics
AI Quick Summary
This paper evaluates the effectiveness of five basic tabular data visualizations across ten tasks and three data attribute types using real-world datasets. The study finds significant variations in effectiveness based on task and data context, suggesting context-dependent design benefits and providing task-specific visualization recommendations.
Paper Preview
Abstract
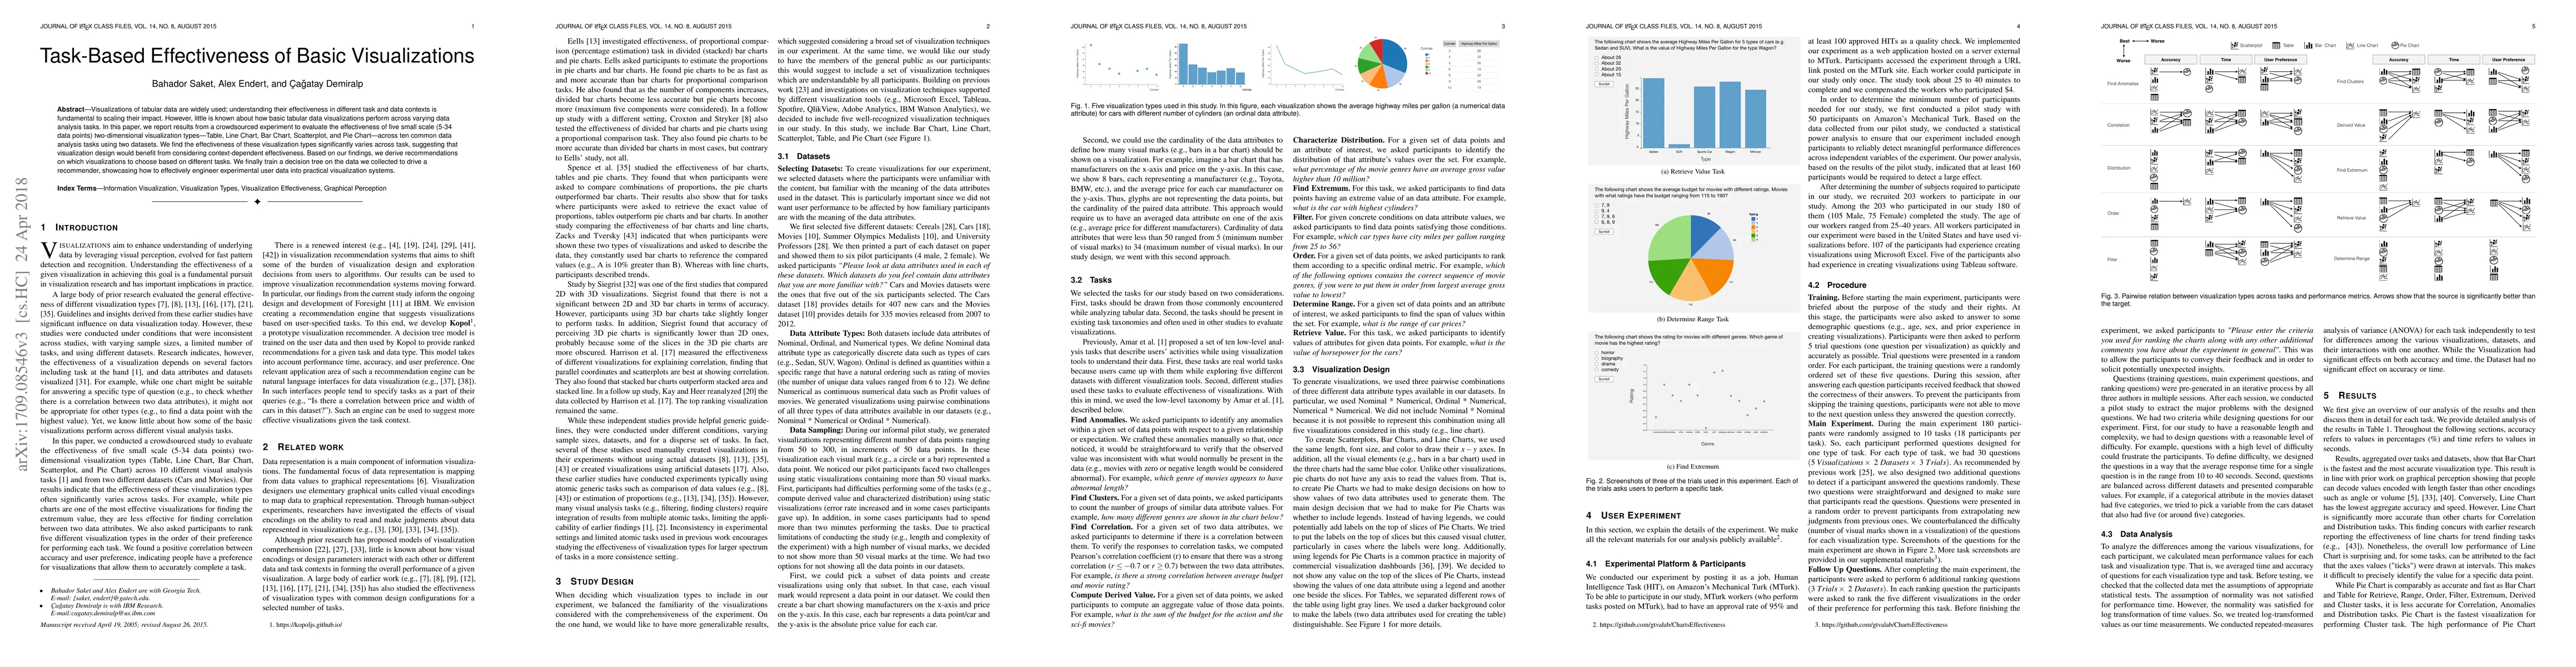
Visualizations of tabular data are widely used; understanding their effectiveness in different task and data contexts is fundamental to scaling their impact. However, little is known about how basic tabular data visualizations perform across varying data analysis tasks and data attribute types. In this paper, we report results from a crowdsourced experiment to evaluate the effectiveness of five visualization types --- Table, Line Chart, Bar Chart, Scatterplot, and Pie Chart --- across ten common data analysis tasks and three data attribute types using two real-world datasets. We found the effectiveness of these visualization types significantly varies across task and data attribute types, suggesting that visualization design would benefit from considering context dependent effectiveness. Based on our findings, we derive recommendations on which visualizations to choose based on different tasks. We finally train a decision tree on the data we collected to drive a recommender, showcasing how to effectively engineer experimental user data into practical visualization systems.
AI Key Findings
Get AI-generated insights about this paper's methodology, results, significance, and more — seven facets brought into focus.
Impact
Paper Details
PDF Preview
Key Terms
Citation Network
Current paper (gray), citations (green), references (blue)
Display is limited for performance on very large graphs.
Discussion 0