Task-Based Effectiveness of Interactive Contiguous Area Cartograms
Publication
Metrics
AI Quick Summary
This study investigates the effectiveness of interactive contiguous area cartograms in visual analysis tasks. Results show that while elementary tasks are equally well performed with or without interactivity, interactive features significantly aid in synoptic tasks. Participants found the interactive features easy to use and helpful, suggesting that animations are particularly beneficial for enhancing cartogram readability.
Paper Preview
Abstract
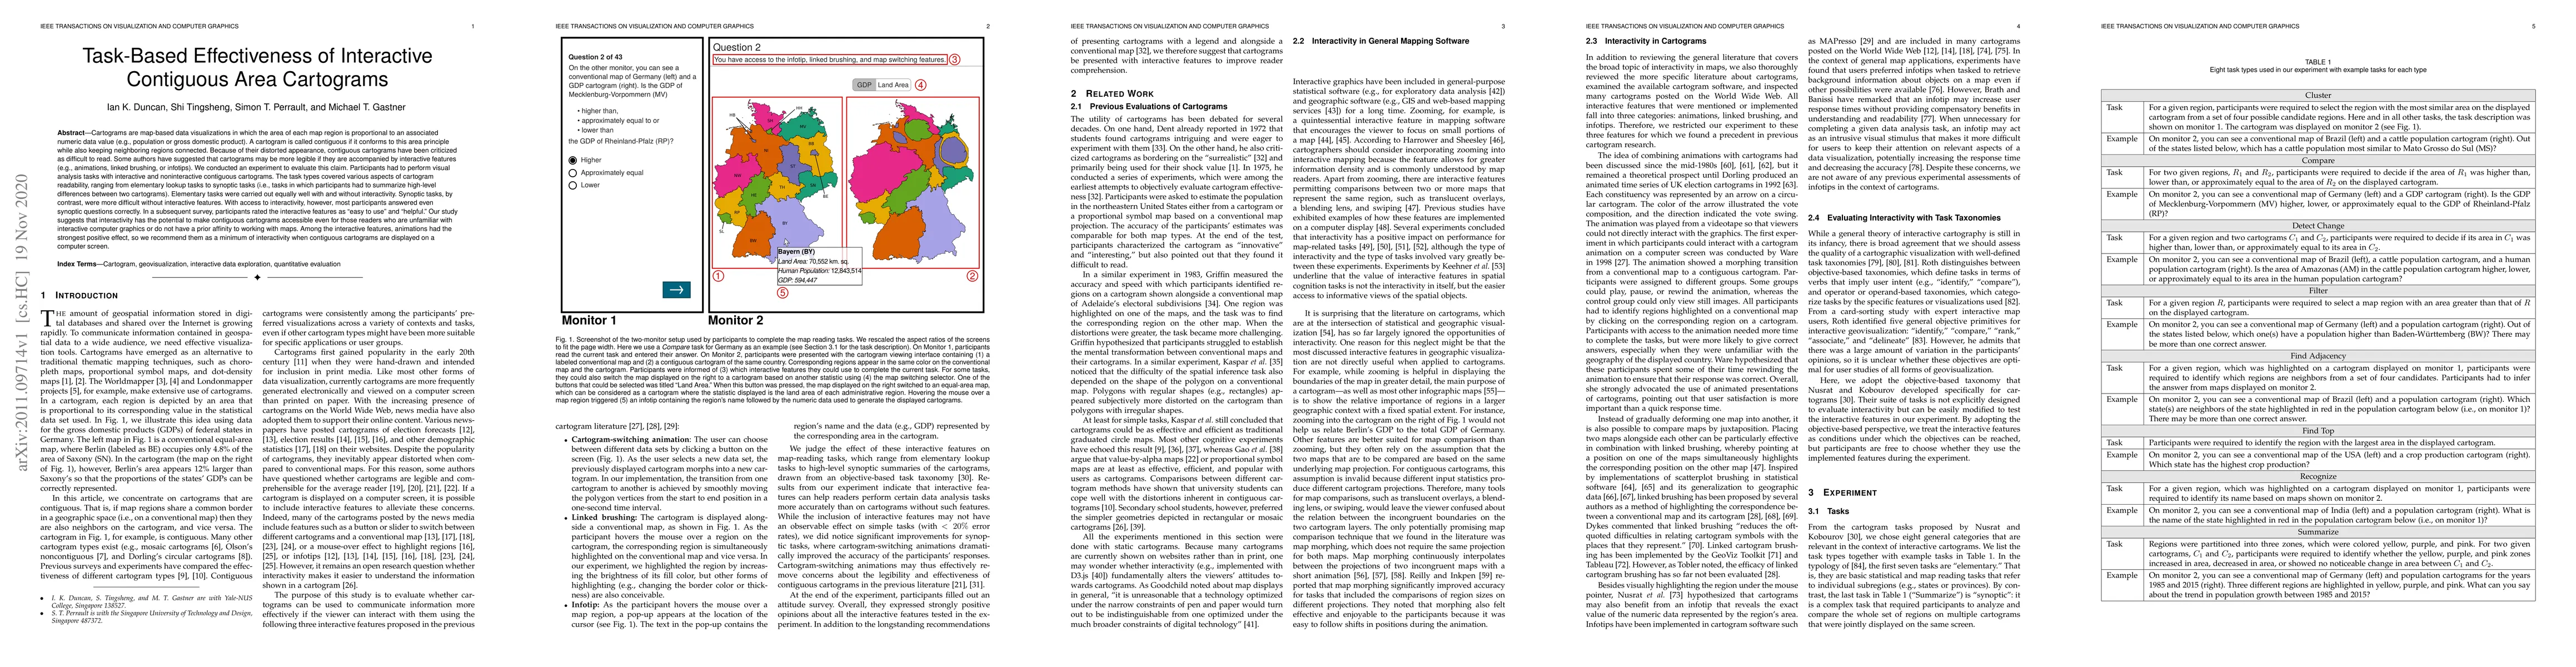
Cartograms are map-based data visualizations in which the area of each map region is proportional to an associated numeric data value (e.g., population or gross domestic product). A cartogram is called contiguous if it conforms to this area principle while also keeping neighboring regions connected. Because of their distorted appearance, contiguous cartograms have been criticized as difficult to read. Some authors have suggested that cartograms may be more legible if they are accompanied by interactive features (e.g., animations, linked brushing, or infotips). We conducted an experiment to evaluate this claim. Participants had to perform visual analysis tasks with interactive and noninteractive contiguous cartograms. The task types covered various aspects of cartogram readability, ranging from elementary lookup tasks to synoptic tasks (i.e., tasks in which participants had to summarize high-level differences between two cartograms). Elementary tasks were carried out equally well with and without interactivity. Synoptic tasks, by contrast, were more difficult without interactive features. With access to interactivity, however, most participants answered even synoptic questions correctly. In a subsequent survey, participants rated the interactive features as "easy to use" and "helpful." Our study suggests that interactivity has the potential to make contiguous cartograms accessible even for those readers who are unfamiliar with interactive computer graphics or do not have a prior affinity to working with maps. Among the interactive features, animations had the strongest positive effect, so we recommend them as a minimum of interactivity when contiguous cartograms are displayed on a computer screen.
AI Key Findings — Failed
Key findings generation failed. Failed to start generation process
Impact
Paper Details
Authors
PDF Preview
Key Terms
Citation Network
Current paper (gray), citations (green), references (blue)
Display is limited for performance on very large graphs.
Discussion 0