Summary
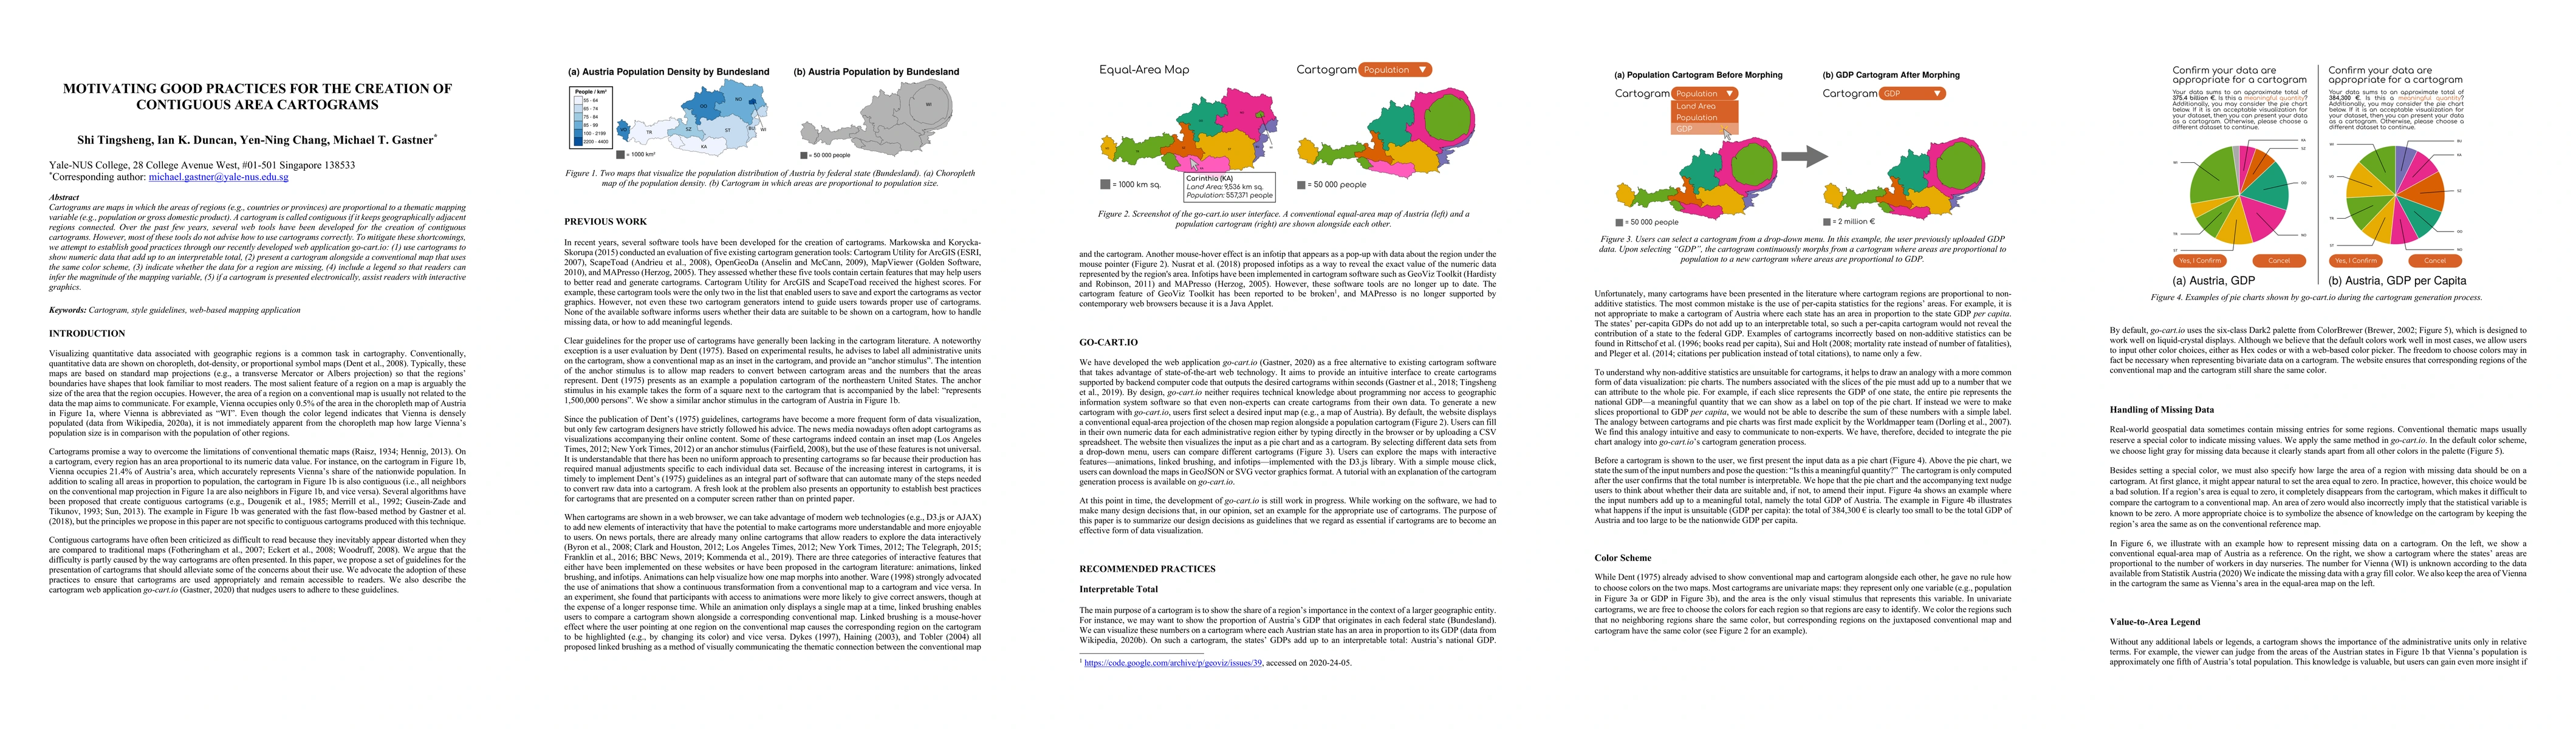
Cartograms are maps in which the areas of regions (e.g., countries or provinces) are proportional to a thematic mapping variable (e.g., population or gross domestic product). A cartogram is called contiguous if it keeps geographically adjacent regions connected. Over the past few years, several web tools have been developed for the creation of contiguous cartograms. However, most of these tools do not advise how to use cartograms correctly. To mitigate these shortcomings, we attempt to establish good practices through our recently developed web application go-cart.io: (1) use cartograms to show numeric data that add up to an interpretable total, (2) present a cartogram alongside a conventional map that uses the same color scheme, (3) indicate whether the data for a region are missing, (4) include a legend so that readers can infer the magnitude of the mapping variable, (5) if a cartogram is presented electronically, assist readers with interactive graphics.
AI Key Findings
Get AI-generated insights about this paper's methodology, results, and significance.
Paper Details
PDF Preview
Key Terms
Citation Network
Current paper (gray), citations (green), references (blue)
Display is limited for performance on very large graphs.
Similar Papers
Found 4 papersTask-Based Effectiveness of Interactive Contiguous Area Cartograms
Simon T. Perrault, Ian K. Duncan, Michael T. Gastner et al.
Effectiveness of Area-to-Value Legends and Grid Lines in Contiguous Area Cartograms
Simon T. Perrault, Michael T. Gastner, Kelvin L. T. Fung
Comparative evaluation of the web-based contiguous cartogram generation tool go-cart.io
Ian K. Duncan, Michael T. Gastner
| Title | Authors | Year | Actions |
|---|
Comments (0)