Comparative evaluation of the web-based contiguous cartogram generation tool go-cart.io
Publication
Metrics
AI Quick Summary
This study compares two web-based tools, fBlog and go-cart.io, for generating contiguous area cartograms, finding that go-cart.io is more usable despite complex UI and limited data import formats. Recommendations for improvement are proposed.
Paper Preview
Abstract
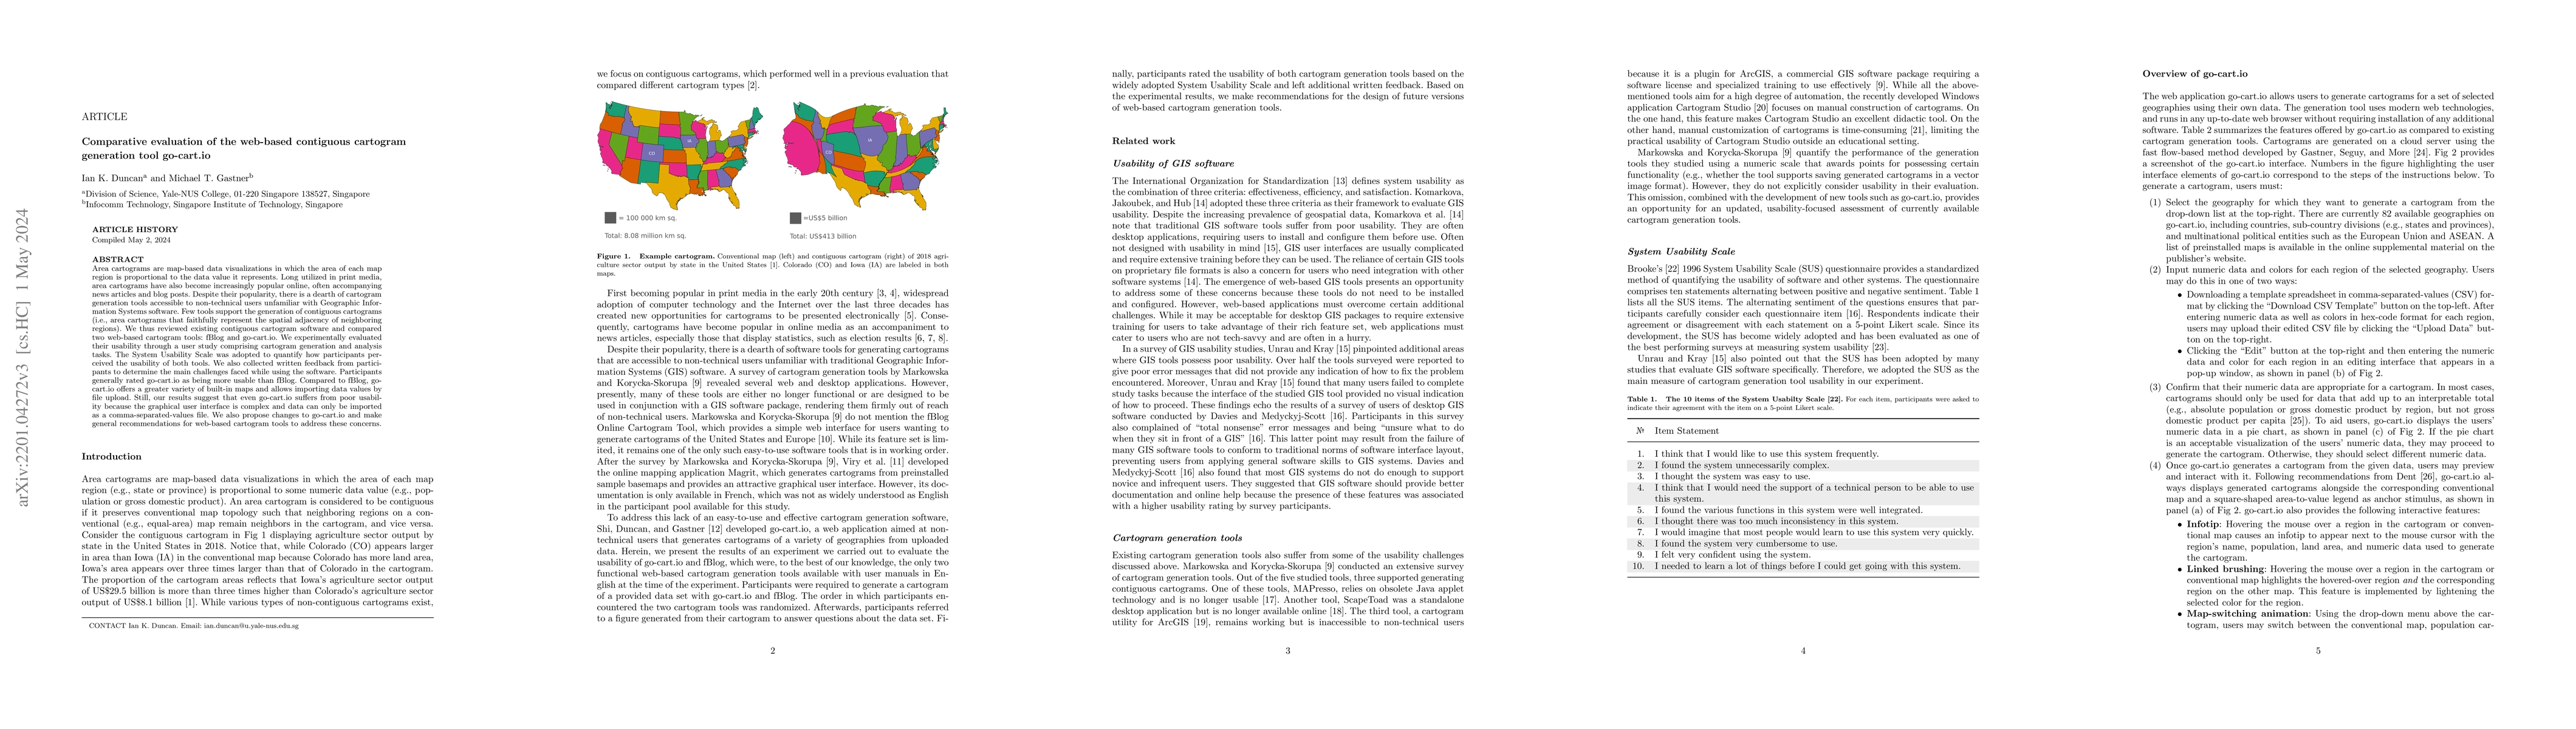
Area cartograms are map-based data visualizations in which the area of each map region is proportional to the data value it represents. Long utilized in print media, area cartograms have also become increasingly popular online, often accompanying news articles and blog posts. Despite their popularity, there is a dearth of cartogram generation tools accessible to non-technical users unfamiliar with Geographic Information Systems software. Few tools support the generation of contiguous cartograms (i.e., area cartograms that faithfully represent the spatial adjacency of neighboring regions). We thus reviewed existing contiguous cartogram software and compared two web-based cartogram tools: fBlog and go-cart.io. We experimentally evaluated their usability through a user study comprising cartogram generation and analysis tasks. The System Usability Scale was adopted to quantify how participants perceived the usability of both tools. We also collected written feedback from participants to determine the main challenges faced while using the software. Participants generally rated go-cart.io as being more usable than fBlog. Compared to fBlog, go-cart.io offers a greater variety of built-in maps and allows importing data values by file upload. Still, our results suggest that even go-cart.io suffers from poor usability because the graphical user interface is complex and data can only be imported as a comma-separated-values file. We also propose changes to go-cart.io and make general recommendations for web-based cartogram tools to address these concerns.
AI Key Findings
Get AI-generated insights about this paper's methodology, results, significance, and more — seven facets brought into focus.
Impact
Paper Details
Authors
PDF Preview
Key Terms
Citation Network
Current paper (gray), citations (green), references (blue)
Display is limited for performance on very large graphs.
Discussion 0