Visual Analytics approach for finding spatiotemporal patterns from COVID19
Publication
Metrics
Paper Preview
Abstract
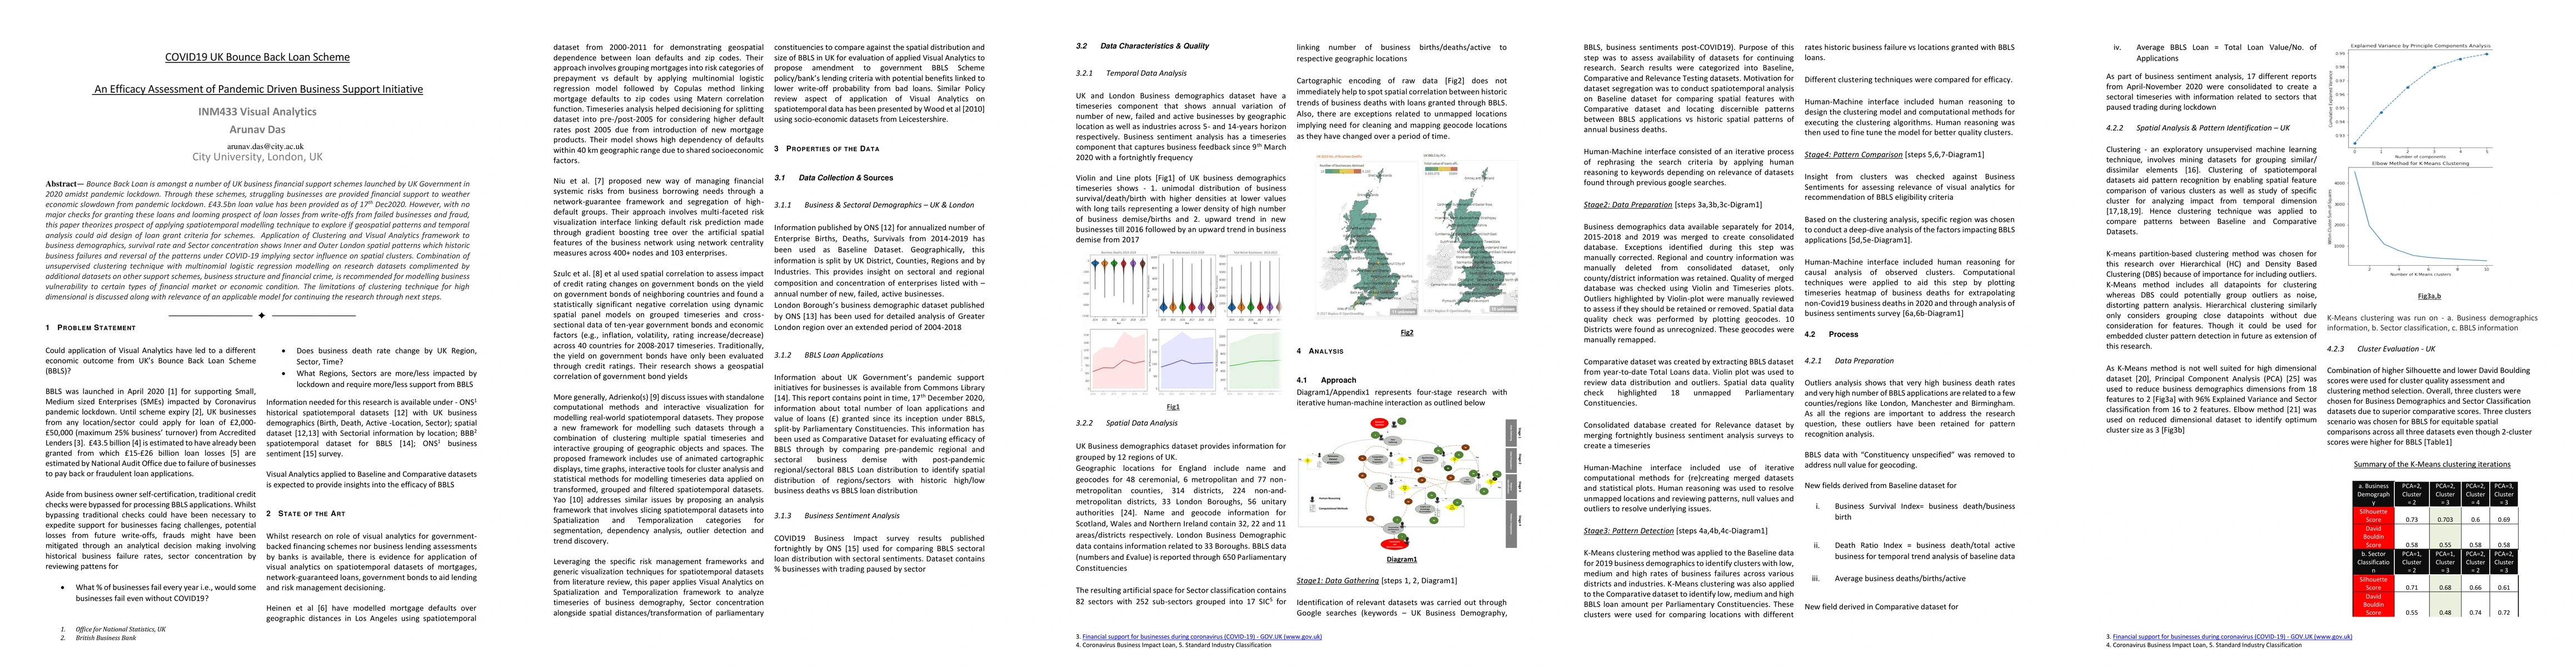
Bounce Back Loan is amongst a number of UK business financial support schemes launched by UK Government in 2020 amidst pandemic lockdown. Through these schemes, struggling businesses are provided financial support to weather economic slowdown from pandemic lockdown. {\pounds}43.5bn loan value has been provided as of 17th Dec2020. However, with no major checks for granting these loans and looming prospect of loan losses from write-offs from failed businesses and fraud, this paper theorizes prospect of applying spatiotemporal modelling technique to explore if geospatial patterns and temporal analysis could aid design of loan grant criteria for schemes. Application of Clustering and Visual Analytics framework to business demographics, survival rate and Sector concentration shows Inner and Outer London spatial patterns which historic business failures and reversal of the patterns under COVID-19 implying sector influence on spatial clusters. Combination of unsupervised clustering technique with multinomial logistic regression modelling on research datasets complimented by additional datasets on other support schemes, business structure and financial crime, is recommended for modelling business vulnerability to certain types of financial market or economic condition. The limitations of clustering technique for high dimensional is discussed along with relevance of an applicable model for continuing the research through next steps.
AI Key Findings
Get AI-generated insights about this paper's methodology, results, significance, and more — seven facets brought into focus.
Impact
Paper Details
Authors
PDF Preview
Key Terms
Citation Network
Current paper (gray), citations (green), references (blue)
Display is limited for performance on very large graphs.
Discussion 0