VINE: Visualizing Statistical Interactions in Black Box Models
Publication
Metrics
AI Quick Summary
VINE is a new algorithm designed to extract and visualize statistical interaction effects in complex machine learning models, addressing the need for interpretable explanations and regional model behavior insights. It also introduces a new evaluation metric for interpretable machine learning visualizations.
Paper Preview
Abstract
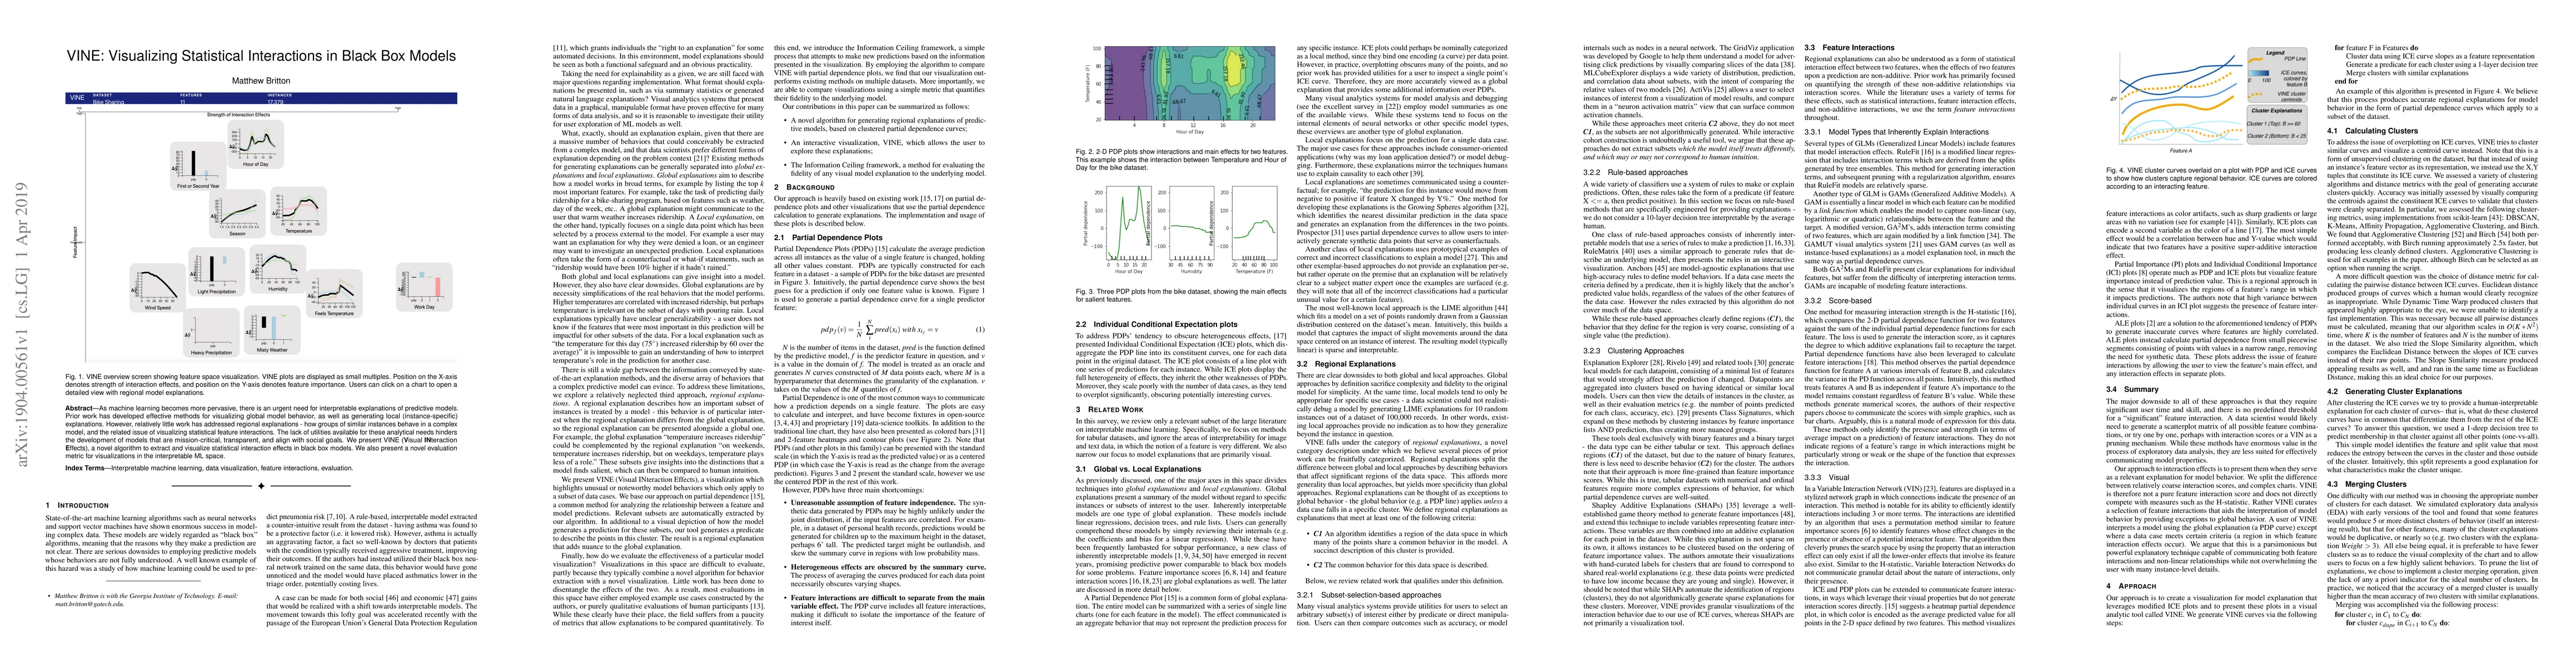
As machine learning becomes more pervasive, there is an urgent need for interpretable explanations of predictive models. Prior work has developed effective methods for visualizing global model behavior, as well as generating local (instance-specific) explanations. However, relatively little work has addressed regional explanations - how groups of similar instances behave in a complex model, and the related issue of visualizing statistical feature interactions. The lack of utilities available for these analytical needs hinders the development of models that are mission-critical, transparent, and align with social goals. We present VINE (Visual INteraction Effects), a novel algorithm to extract and visualize statistical interaction effects in black box models. We also present a novel evaluation metric for visualizations in the interpretable ML space.
AI Key Findings
Get AI-generated insights about this paper's methodology, results, significance, and more — seven facets brought into focus.
Impact
Paper Details
PDF Preview
Key Terms
Citation Network
Current paper (gray), citations (green), references (blue)
Display is limited for performance on very large graphs.
Discussion 0