Visualizing the Effects of Predictor Variables in Black Box Supervised Learning Models
Publication
Metrics
AI Quick Summary
This paper introduces accumulated local effects (ALE) plots, a new visualization method for black box supervised learning models, offering a reliable alternative to partial dependence plots (PD) and marginal plots (M). Unlike PD plots, ALE plots avoid extrapolation, and unlike M plots, they do not suffer from omitted variable bias, providing a more accurate depiction of predictor variable effects.
Paper Preview
Abstract
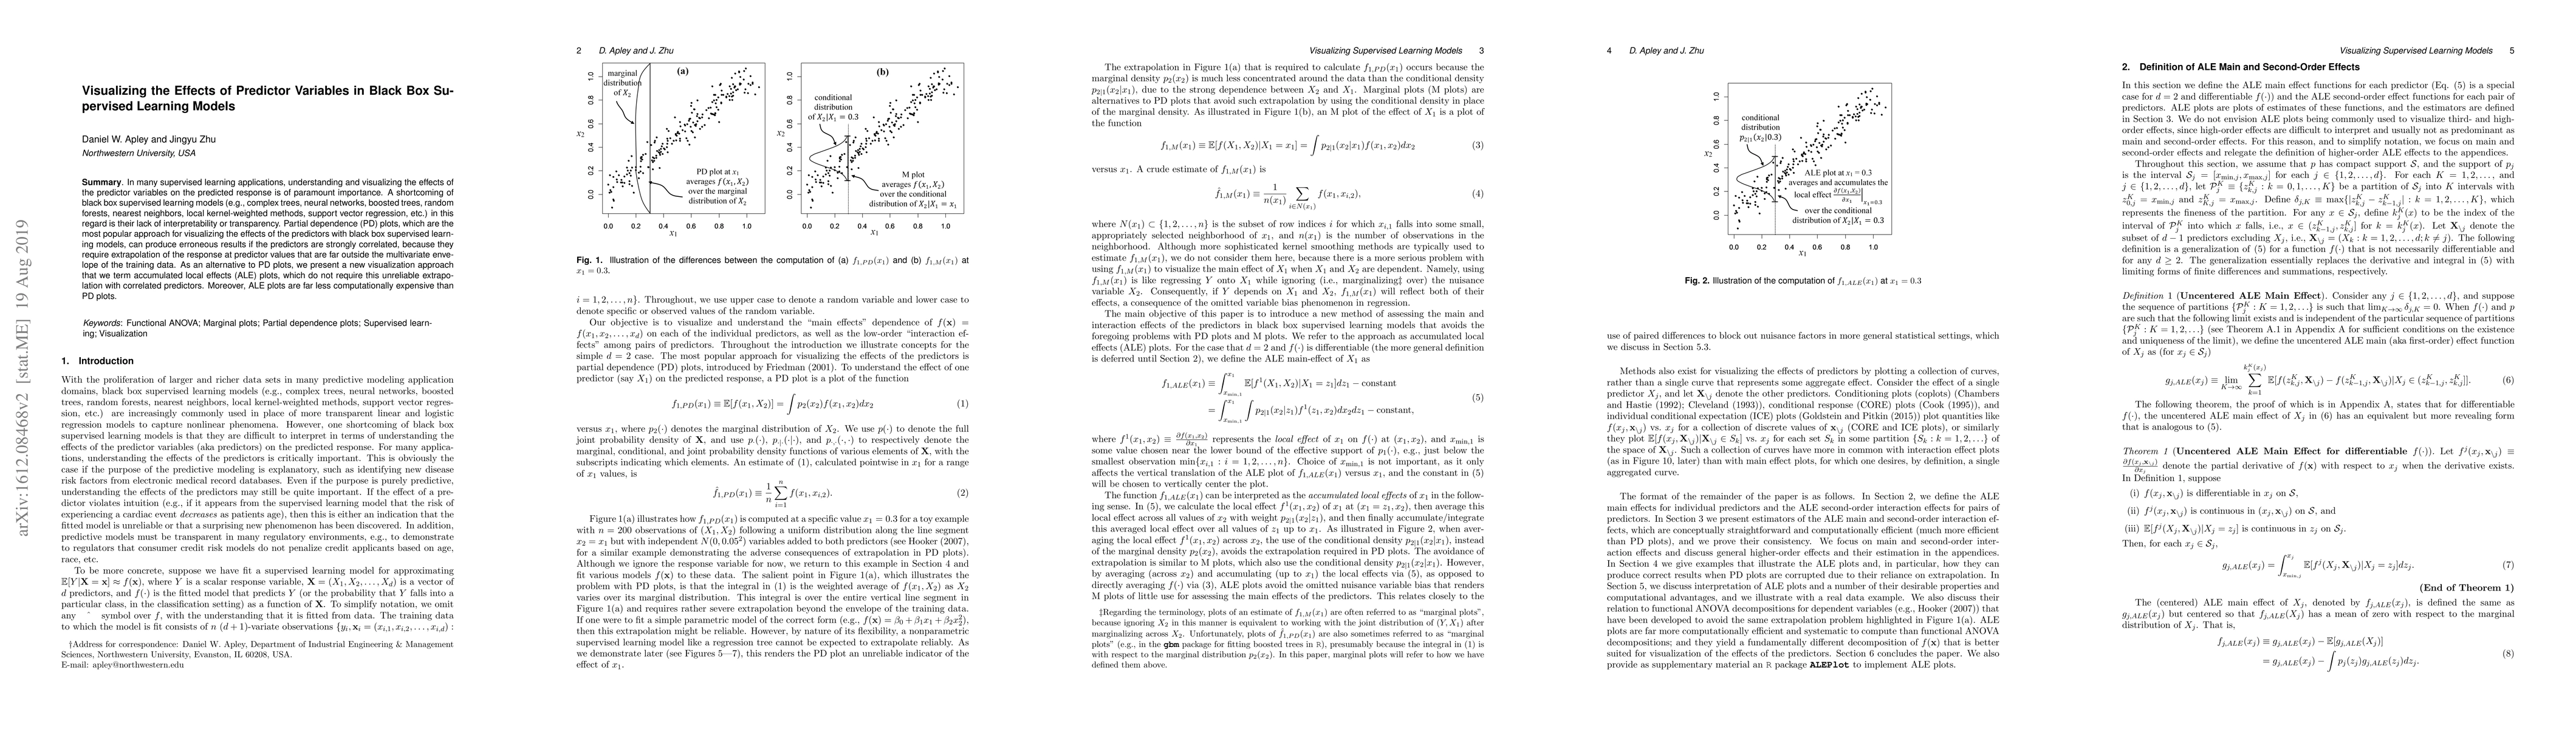
When fitting black box supervised learning models (e.g., complex trees, neural networks, boosted trees, random forests, nearest neighbors, local kernel-weighted methods, etc.), visualizing the main effects of the individual predictor variables and their low-order interaction effects is often important, and partial dependence (PD) plots are the most popular approach for accomplishing this. However, PD plots involve a serious pitfall if the predictor variables are far from independent, which is quite common with large observational data sets. Namely, PD plots require extrapolation of the response at predictor values that are far outside the multivariate envelope of the training data, which can render the PD plots unreliable. Although marginal plots (M plots) do not require such extrapolation, they produce substantially biased and misleading results when the predictors are dependent, analogous to the omitted variable bias in regression. We present a new visualization approach that we term accumulated local effects (ALE) plots, which inherits the desirable characteristics of PD and M plots, without inheriting their preceding shortcomings. Like M plots, ALE plots do not require extrapolation; and like PD plots, they are not biased by the omitted variable phenomenon. Moreover, ALE plots are far less computationally expensive than PD plots.
AI Key Findings
Get AI-generated insights about this paper's methodology, results, significance, and more — seven facets brought into focus.
Impact
Paper Details
PDF Preview
Key Terms
Citation Network
Current paper (gray), citations (green), references (blue)
Display is limited for performance on very large graphs.
Discussion 0