Publication
Metrics
AI Quick Summary
VisGrader automates the grading of D3 visualizations, evaluating data bindings, visual encodings, interactions, and design specifications to provide scalable and precise feedback. This method has been successfully deployed in a Georgia Tech course, benefiting over 4000 students by enabling frequent submissions and rapid feedback.
Paper Preview
Abstract
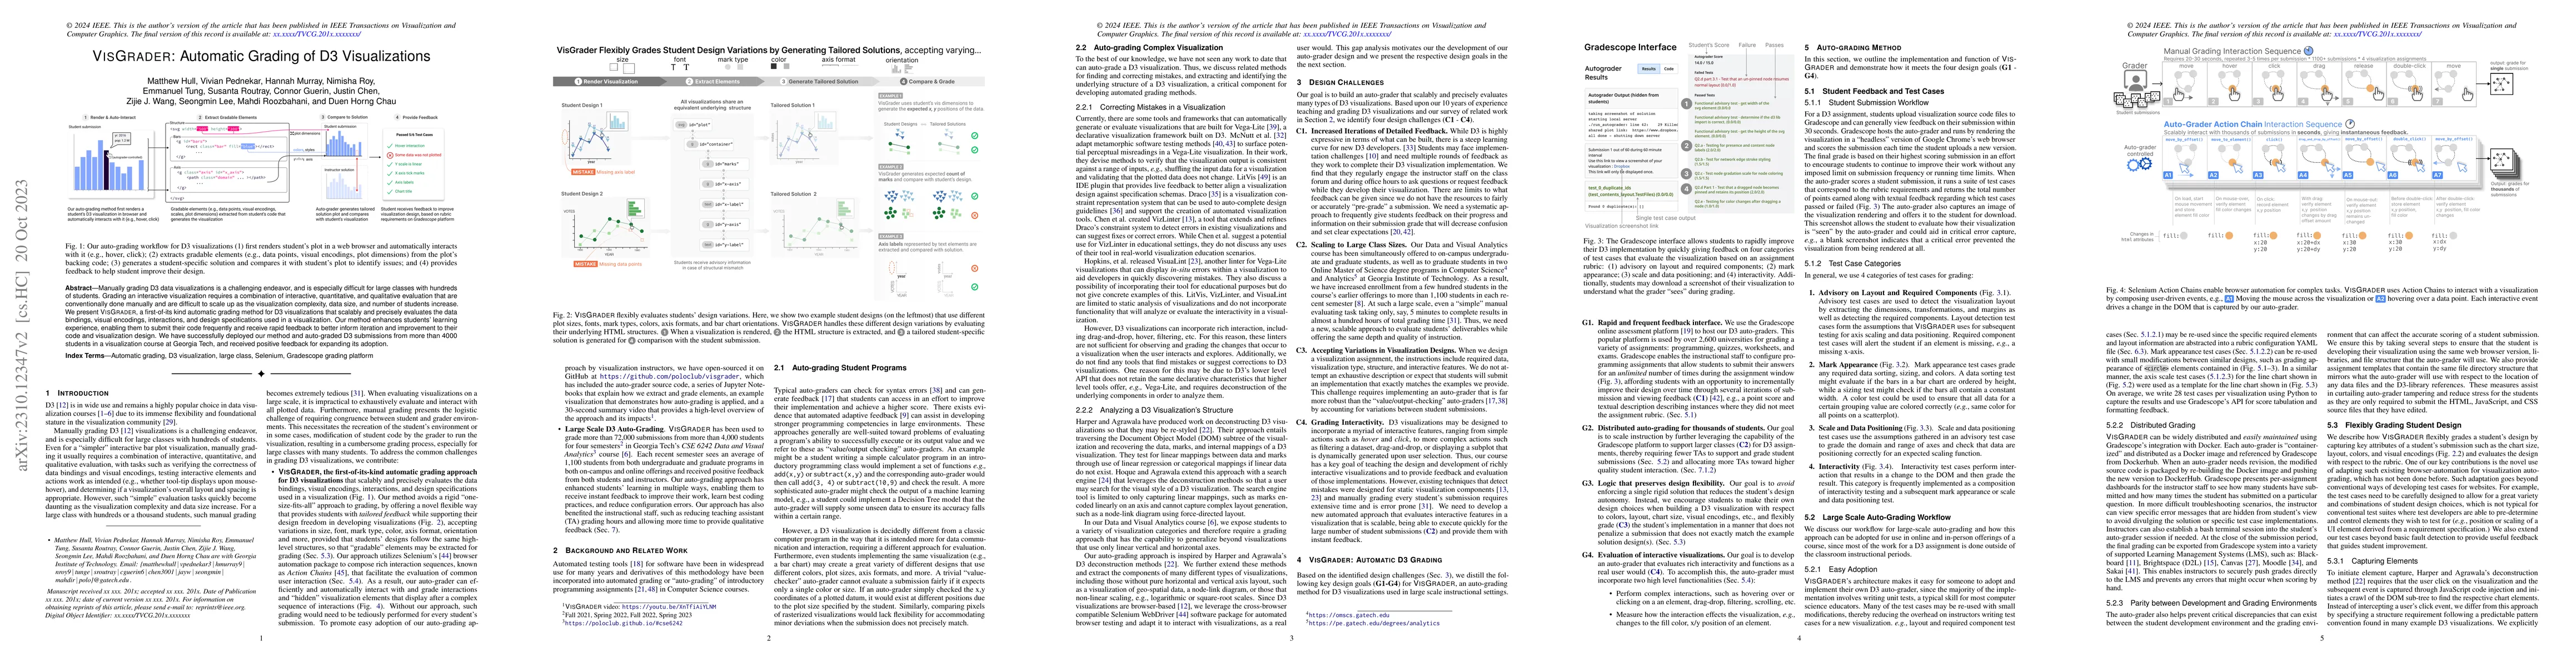
Manually grading D3 data visualizations is a challenging endeavor, and is especially difficult for large classes with hundreds of students. Grading an interactive visualization requires a combination of interactive, quantitative, and qualitative evaluation that are conventionally done manually and are difficult to scale up as the visualization complexity, data size, and number of students increase. We present VisGrader, a first-of-its kind automatic grading method for D3 visualizations that scalably and precisely evaluates the data bindings, visual encodings, interactions, and design specifications used in a visualization. Our method enhances students learning experience, enabling them to submit their code frequently and receive rapid feedback to better inform iteration and improvement to their code and visualization design. We have successfully deployed our method and auto-graded D3 submissions from more than 4000 students in a visualization course at Georgia Tech, and received positive feedback for expanding its adoption.
AI Key Findings
Get AI-generated insights about this paper's methodology, results, significance, and more — seven facets brought into focus.
Impact
Paper Details
Authors
PDF Preview
Key Terms
Citation Network
Current paper (gray), citations (green), references (blue)
Display is limited for performance on very large graphs.
Discussion 0