ArxivLens

Quick Summary:

This paper introduces a search engine for D3 visualizations that enables querying based on visual style and structure. The engine indexes visual style and structural data from a collection of 7860 D3 charts, allowing developers to explore design patterns and find specific design characteristics more effectively than traditional keyword searches.

DOI: 10.1109/TVCG.2019.2934431
arXiv Id: 1907.11265
Date Published: 2019-10-17
Date Updated: 2019-10-17

Categories:

Key Terms (TF-IDF):

engine (0.371)
engine (0.355)
search (0.278)
style (0.266)
search (0.259)
style (0.257)
collection (0.230)
developers (0.229)
collection (0.228)
developers (0.218)
visualization (0.217)
visual (0.216)
attributes (0.214)
visual (0.210)
designs (0.205)
attributes (0.204)
designs (0.202)
encoding (0.202)
encoding (0.190)
containing (0.172)
License: http://arxiv.org/licenses/nonexclusive-distrib/1.0/

Summary:

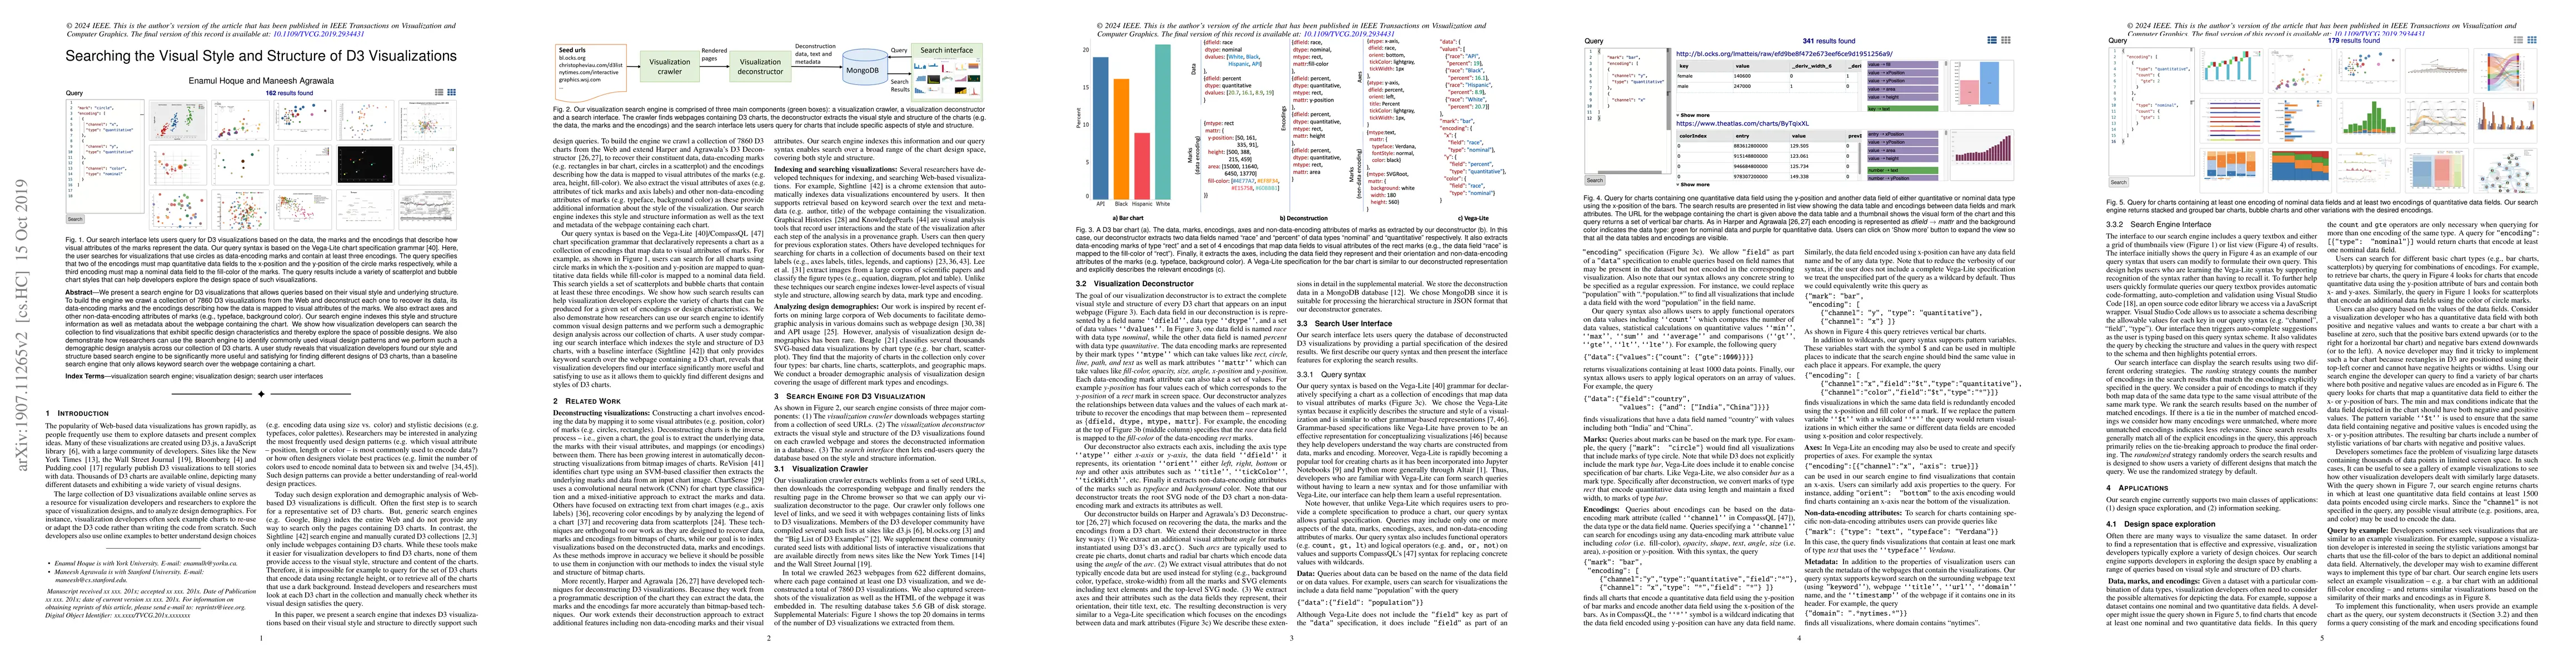
We present a search engine for D3 visualizations that allows queries based on their visual style and underlying structure. To build the engine we crawl a collection of 7860 D3 visualizations from the Web and deconstruct each one to recover its data, its data-encoding marks and the encodings describing how the data is mapped to visual attributes of the marks. We also extract axes and other non-data-encoding attributes of marks (e.g., typeface, background color). Our search engine indexes this style and structure information as well as metadata about the webpage containing the chart. We show how visualization developers can search the collection to find visualizations that exhibit specific design characteristics and thereby explore the space of possible designs. We also demonstrate how researchers can use the search engine to identify commonly used visual design patterns and we perform such a demographic design analysis across our collection of D3 charts. A user study reveals that visualization developers found our style and structure based search engine to be significantly more useful and satisfying for finding different designs of D3 charts, than a baseline search engine that only allows keyword search over the webpage containing a chart.

Citation & Reference Network Visualization

This graph shows how this paper is connected to other research. The current paper is shown in dark gray, papers that cite it are in green, and papers it references are in blue. You can:

Current Paper
Papers citing this work (Citations)
Papers cited by this work (References)

• Hover over any node to see the paper title

• Click a node to view that paper's details

• Drag nodes to rearrange the graph

• Use the zoom controls (bottom right) to zoom in/out

Citations and References

Title Authors Year Actions
ChartQAPro: A More Diverse and Challenging Benchmark for Chart Question Answering
Ahmed Masry, Mohammed Saidul Islam, Mahir Ahmed, Aayush Bajaj, Firoz Kabir, Aaryaman Kartha, Md Tahmid Rahman Laskar, Mizanur Rahman, Shadikur Rahman, Mehrad Shahmohammadi, Megh Thakkar, Md. Rizwan Parvez, Enamul Hoque, Shafiq R. Joty
2025
View Paper
FactFlow: Automatic Fact Sheet Generation and Customization from Tabular Dataset via AI Chain Design&Implementation
Minh Duc Vu, Jieshan Chen, Zhenchang Xing, Qinghua Lu, Xiwei Xu, Qian Fu
2025
View Paper
ChartKG: A Knowledge-Graph-Based Representation for Chart Images
Zhiguang Zhou, Haoxuan Wang, Zhengqing Zhao, Fengling Zheng, Yongheng Wang, Wei Chen, Yong Wang
2024
View Paper
Natural Language Generation for Visualizations: State of the Art, Challenges and Future Directions
Enamul Hoque, Mohammed Saidul Islam
2024
View Paper
The Story Behind the Lines: Line Charts as a Gateway to Dataset Discovery
Daomin Ji, Hui Luo, Zhifeng Bao, J. Culpepper
2024
View Paper
Datasets of Visualization for Machine Learning
Can Liu, Ruike Jiang, Shaocong Tan, Jiacheng Yu, Chaofan Yang, Hanning Shao, Xiaoru Yuan
2024
View Paper
AutoLegend: A User Feedback-Driven Adaptive Legend Generator for Visualizations
Can Liu, Xiyao Mei, Zhibang Jiang, Shaocong Tan, Xiaoru Yuan
2024
View Paper
Hierarchically Recognizing Vector Graphics and A New Chart-Based Vector Graphics Dataset
Shuguang Dou, Xinyang Jiang, Lu Liu, Lu Ying, Caihua Shan, Yifei Shen, Xuanyi Dong, Yun Wang, Dongsheng Li, Cairong Zhao
2024
View Paper
ChartInstruct: Instruction Tuning for Chart Comprehension and Reasoning
Ahmed Masry, Mehrad Shahmohammadi, Md. Rizwan Parvez, Enamul Hoque, Shafiq R. Joty
2024
View Paper
VG: Automatic Grading of D3 Visualizations
Matthew Hull, Vivian Pednekar, Hannah Murray, Nimisha Roy, Emmanuel Tung, Susanta Routray, Connor Guerin, Justin Chen, Zijie J. Wang, Seongmin Lee, M. Roozbahani, Duen Horng Chau
2023
View Paper
Interactive Flexible Style Transfer for Vector Graphics
Jeremy Warner, Kyu Won Kim, Bjoern Hartmann
2023
View Paper
Reviving Static Charts into Live Charts
Lu Ying, Yun Wang, Haotian Li, Shuguang Dou, Haidong Zhang, Xinyang Jiang, Huamin Qu, Yingcai Wu
2023
View Paper
OldVisOnline: Curating a Dataset of Historical Visualizations
Yu Zhang, Ruike Jiang, Liwenhan Xie, Yuheng Zhao, Can Liu, Tianhong Ding, Siming Chen, Xiaoru Yuan
2023
View Paper
Olio: A Semantic Search Interface for Data Repositories
V. Setlur, Andriy Kanyuka, Arjun Srinivasan
2023
View Paper
Toward a Scalable Census of Dashboard Designs in the Wild: A Case Study with Tableau Public
Joanna Purich, Arjun Srinivasan, M. Correll, L. Battle, V. Setlur, Anamaria Crisan
2023
View Paper
VIS+AI: integrating visualization with artificial intelligence for efficient data analysis
Xumeng Wang, Ziliang Wu, Wenqi Huang, Yating Wei, Zhaosong Huang, Mingliang Xu, Wei Chen
2023
View Paper
Learned Data-aware Image Representations of Line Charts for Similarity Search
Yuyu Luo, Yihui Zhou, Nan Tang, Guoliang Li, Chengliang Chai, Leixian Shen
2023
View Paper
The State of the Art in Creating Visualization Corpora for Automated Chart Analysis
Chen Chen, Zhicheng Liu
2023
View Paper
Drawing Transforms: A Unifying Interaction Primitive to Procedurally Manipulate Graphics across Style, Space, and Time
Sonia Hashim, Tobias Höllerer, Jennifer Jacobs
2023
View Paper
ChartDetective: Easy and Accurate Interactive Data Extraction from Complex Vector Charts
Damien Masson, Sylvain Malacria, Daniel Vogel, E. Lank, Géry Casiez
2023
View Paper
WYTIWYR: A User Intent‐Aware Framework with Multi‐modal Inputs for Visualization Retrieval
Shishi Xiao, Yihan Hou, Cheng Jin, Weizhen Zeng
2023
View Paper
SeeChart: Enabling Accessible Visualizations Through Interactive Natural Language Interface For People with Visual Impairments
Md. Zubair Ibne Alam, Shehnaz Islam, Enamul Hoque
2023
View Paper
VISAtlas: An Image-Based Exploration and Query System for Large Visualization Collections via Neural Image Embedding
Yilin Ye, Rong Huang, Weizhen Zeng
2022
View Paper
VAID: Indexing View Designs in Visual Analytics System
Lu Ying, Aoyu Wu, Haotian Li, Zikun Deng, Ji Lan, Jiang Wu, Yong Wang, Huamin Qu, Dazhen Deng, Yingcai Wu
2022
View Paper
Photosensitive Accessibility for Interactive Data Visualizations
Laura South, M. Borkin
2022
View Paper
Understanding how Designers Find and Use Data Visualization Examples
Hannah K. Bako, Xinyi Liu, L. Battle, Zhicheng Liu
2022
View Paper
Streamlining Visualization Authoring in D3 Through User-Driven Templates
Hannah K. Bako, Alisha Varma, Anuoluwapo Faboro, Mahreen Haider, Favour Nerrise, B. Kenah, L. Battle
2022
View Paper
Chart Question Answering: State of the Art and Future Directions
Enamul Hoque, P. Kavehzadeh, Ahmed Masry
2022
View Paper
ComputableViz: Mathematical Operators as a Formalism for Visualisation Processing and Analysis
Aoyu Wu, Wai Tong, Haotian Li, Dominik Moritz, Yong Wang, Huamin Qu
2022
View Paper
Structure-aware Visualization Retrieval
Haotian Li, Yong Wang, Aoyu Wu, Huan Wei, Huamin Qu
2022
View Paper
Reverse-engineering information presentations: recovering hierarchical grouping from layouts of visual elements
Danqing Shi, Weiwei Cui, Danqing Huang, Haidong Zhang, Nan Cao
2022
View Paper
Graph Interpretation, Summarization and Visualization Techniques: A Review and Open Research Issues
P. Mishra, Santosh Kumar, M. K. Chaube
2022
View Paper
User-Driven Support for Visualization Prototyping in D3
Hannah K. Bako, Alisha Varma, Anuoluwapo Faboro, Mahreen Haider, Favour Nerrise, B. Kenah, John P. Dickerson, L. Battle
2021
View Paper
A Mixed-Initiative Approach to Reusing Infographie Charts
Weiwei Cui, Jinpeng Wang, He Huang, Yun Wang, Chin-Yew Lin, Haidong Zhang, Dongmei Zhang
2021
View Paper
Exploring D3 Implementation Challenges on Stack Overflow
L. Battle, Danni Feng, Kelli Webber
2021
View Paper
Visualizing Examples of Deep Neural Networks at Scale
Litao Yan, Elena L. Glassman, Tianyi Zhang
2021
View Paper
Deep Colormap Extraction From Visualizations
Linping Yuan, Wei Zeng, Siwei Fu, Zhiliang Zeng, Haotian Li, Chi-Wing Fu, Huamin Qu
2021
View Paper
AI4VIS: Survey on Artificial Intelligence Approaches for Data Visualization
Aoyu Wu, Yun Wang, Xinhuan Shu, Dominik Moritz, Weiwei Cui, Haidong Zhang, Dongmei Zhang, Huamin Qu
2021
View Paper
DRUIDJS — A JavaScript Library for Dimensionality Reduction
René Cutura, Christoph Kralj, M. Sedlmair
2020
View Paper
VisCode: Embedding Information in Visualization Images using Encoder-Decoder Network
Peiying Zhang, Chenhui Li, Changbo Wang
2020
View Paper
MobileVisFixer: Tailoring Web Visualizations for Mobile Phones Leveraging an Explainable Reinforcement Learning Framework
Aoyu Wu, Wai-Shun Tong, Tim Dwyer, Bongshin Lee, Petra Isenberg, Huamin Qu
2020
View Paper
Retrieve-Then-Adapt: Example-based Automatic Generation for Proportion-related Infographics
Chunyao Qian, Shizhao Sun, Weiwei Cui, Jian-Guang Lou, Haidong Zhang, Dongmei Zhang
2020
View Paper
Chart Mining: A Survey of Methods for Automated Chart Analysis
Kenny Davila, Srirangaraj Setlur, D. Doermann, Urala Kota Bhargava, V. Govindaraju
2020
View Paper
How do Observable Users Decompose D3 Code? An Exploratory Study
Melissa Lin, Heer Patel, Medina Lamkin, Tukey Tu, Hannah K. Bako, Soham Raut, Leilani Battle
2024
View Paper
User-Driven Support for Rapid Visualization Prototyping in D3
Hannah K. Bako, Alisha Varma, Anuoluwapo Faboro, Mahreen Haider, Favour Nerrise, B. Kenah, John P. Dickerson, L. Battle
2023
View Paper
NLP+Vis: NLP Meets Visualization
Shafiq R. Joty, Enamul Hoque, Jesse Vig
2023
View Paper
User-Driven Support for Rapid Visualization Programming in D3
Hannah K. Bako, Alisha Varma, Anuoluwapo Faboro, Mahreen Haider, Favour Nerrise, John P. Dickerson, L. Battle
2022
View Paper
Enhancing the Security of Data Stored in the Cloud using customized Data Visualization Patterns
Archana M, Gururaj Murtugudde
2022
View Paper
Survey on Artificial Intelligence Approaches for Visualization Data
Aoyu Wu, Yun Wang, Xinhuan Shu, Dominik Moritz, Weiwei Cui, Haidong Zhang, Dongmei Zhang, Huamin Qu
2021
View Paper
Exploring Visualization Implementation Challenges Faced by D3 Users Online
L. Battle, Danni Feng, Kelli Webber
2021
View Paper
Deep Learning for Scatterplot Similarity
2021
View Paper
User-Driven Programming Support for Rapid Visualization Authoring in D3
Hannah K. Bako, Alisha Varma, Anuoluwapo Faboro, Mahreen Haider, Favour Nerrise, John P. Dickerson, Leilani Battle
2021
View Paper

Similar Papers

VisGrader: Automatic Grading of D3 Visualizations

Justin Chen, Seongmin Lee, Zijie J. Wang, Duen Horng Chau, Matthew Hull, Vivian Pednekar, Hannah Murray, Nimisha Roy, Emmanuel Tung, Susanta Routray, Connor Guerin, Mahdi Roozbahani

Published: 2023-10-23

Streamlining Visualization Authoring in D3 Through User-Driven Templates

Hannah Bako, Leilani Battle, Favour Nerrise, Alisha Varma, Anuoluwapo Faboro, Mahreen Haider, Bissaka Kenah

Published: 2023-02-14

Comments (0)

This website uses cookies to ensure you get the best experience. Learn more