Visual Analysis of Multi-Parameter Distributions across Ensembles
Publication
Metrics
AI Quick Summary
This paper introduces a visual analytics technique to analyze multi-parameter distributions across ensemble data points, allowing domain experts to select representative distributions and compare their representativeness.
Paper Preview
Abstract
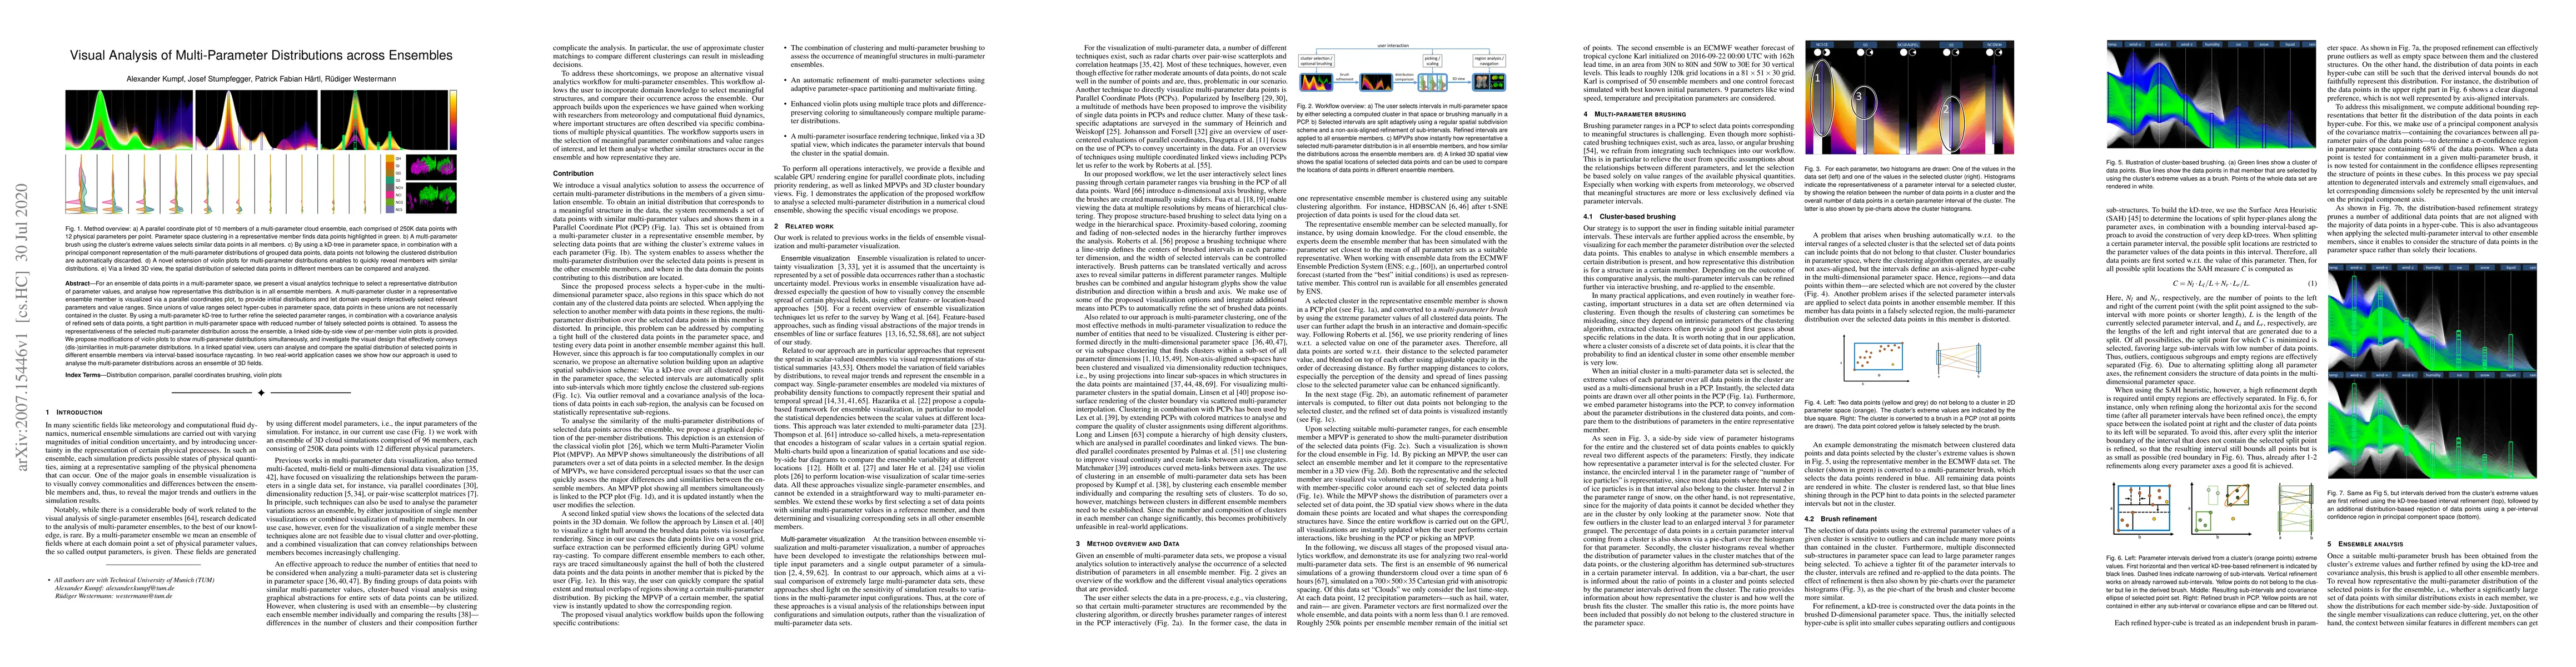
For an ensemble of data points in a multi-parameter space, we present a visual analytics technique to select a representative distribution of parameter values, and analyse how representative this distribution is in all ensemble members. A multi-parameter cluster in a representative ensemble member is visualized via a parallel coordinates plot, to provide initial distributions and let domain experts interactively select relevant parameters and value ranges. Since unions of value ranges select hyper-cubes in parameter space, data points in these unions are not necessarily contained in the cluster. By using a multi-parameter kD-tree to further refine the selected parameter ranges, in combination with a covariance analysis of refined sets of data points, a tight partition in multi-parameter space with reduced number of falsely selected points is obtained. To assess the representativeness of the selected multi-parameter distribution across the ensemble, a linked side-by-side view of per-member violin plots is provided. We propose modifications of violin plots to show multi-parameter distributions simultaneously, and investigate the visual design that effectively conveys (dis-)similarities in multi-parameter distributions. In a linked spatial view, users can analyse and compare the spatial distribution of selected points in different ensemble members via interval-based isosurface raycasting. In two real-world application cases we show how our approach is used to analyse the multi-parameter distributions across an ensemble of 3D fields.
AI Key Findings
Get AI-generated insights about this paper's methodology, results, significance, and more — seven facets brought into focus.
Impact
Paper Details
Authors
PDF Preview
Key Terms
Citation Network
Current paper (gray), citations (green), references (blue)
Display is limited for performance on very large graphs.
Discussion 0