A Visual Sensitivity Analysis for Parameter-Augmented Ensembles of Curves
Publication
Metrics
AI Quick Summary
Researchers developed a system to visualize sensitivity analysis for parameter-augmented ensembles of curves, enabling in-depth analysis of complex simulations and identifying key factors influencing outcomes.
Paper Preview
Abstract
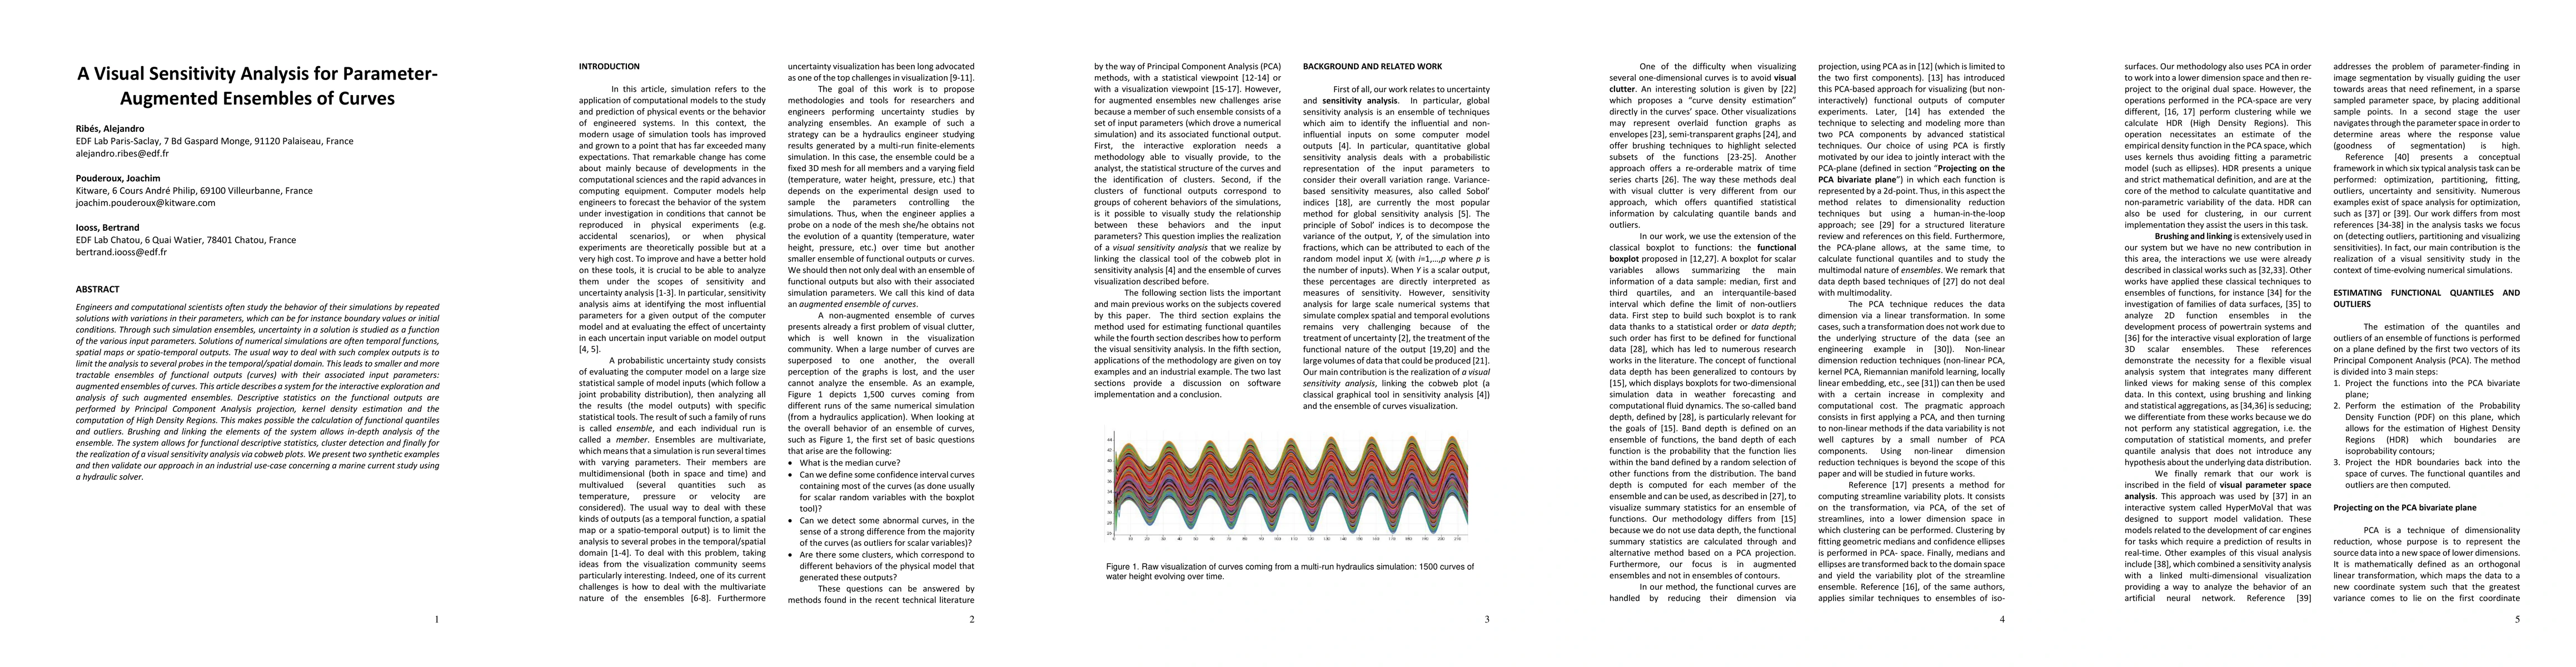
Engineers and computational scientists often study the behavior of their simulations by repeated solutions with variations in their parameters, which can be for instance boundary values or initial conditions. Through such simulation ensembles, uncertainty in a solution is studied as a function of the various input parameters. Solutions of numerical simulations are often temporal functions, spatial maps or spatio-temporal outputs. The usual way to deal with such complex outputs is to limit the analysis to several probes in the temporal/spatial domain. This leads to smaller and more tractable ensembles of functional outputs (curves) with their associated input parameters: augmented ensembles of curves. This article describes a system for the interactive exploration and analysis of such augmented ensembles. Descriptive statistics on the functional outputs are performed by Principal Component Analysis projection, kernel density estimation and the computation of High Density Regions. This makes possible the calculation of functional quantiles and outliers. Brushing and linking the elements of the system allows in-depth analysis of the ensemble. The system allows for functional descriptive statistics, cluster detection and finally for the realization of a visual sensitivity analysis via cobweb plots. We present two synthetic examples and then validate our approach in an industrial use-case concerning a marine current study using a hydraulic solver.
AI Key Findings
Get AI-generated insights about this paper's methodology, results, significance, and more — seven facets brought into focus.
Impact
Paper Details
Authors
PDF Preview
Key Terms
Citation Network
Current paper (gray), citations (green), references (blue)
Display is limited for performance on very large graphs.
Discussion 0