Visual Analytics of Movement Pattern Based on Time-Spatial Data: A Neural Net Approach
Publication
Metrics
Paper Preview
Abstract
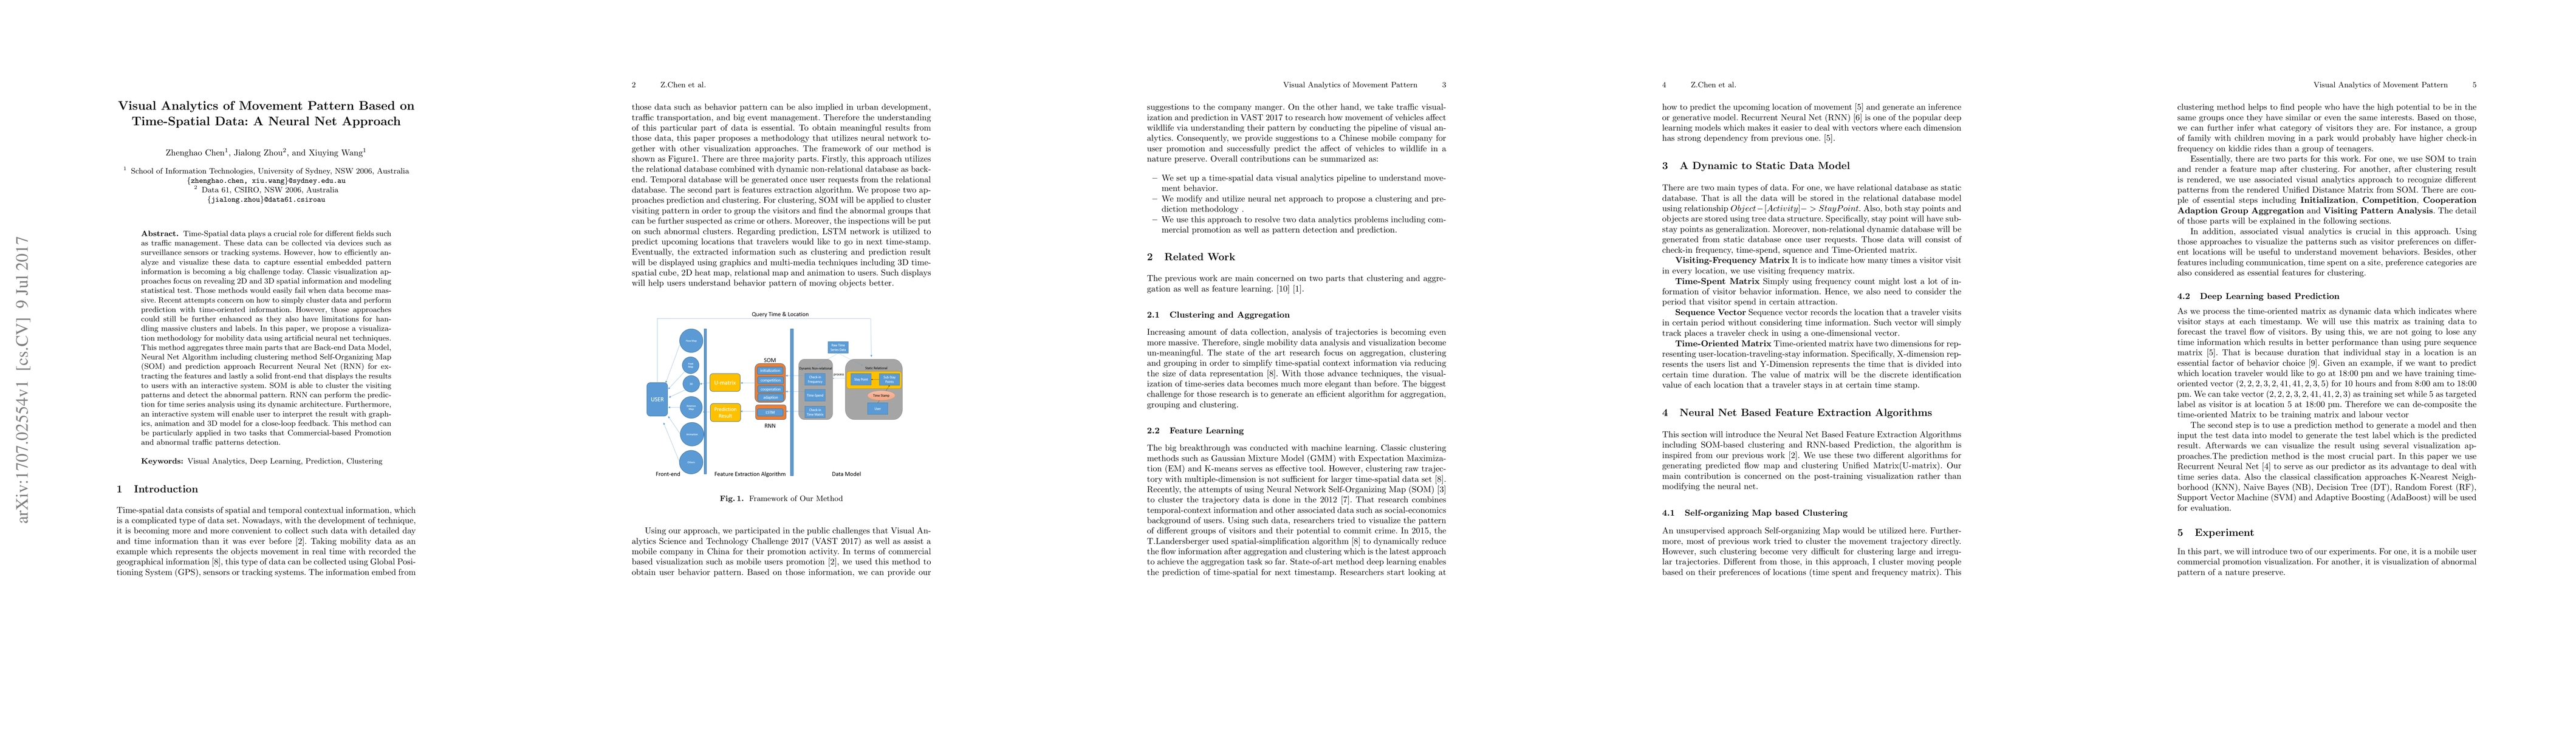
Time-Spatial data plays a crucial role for different fields such as traffic management. These data can be collected via devices such as surveillance sensors or tracking systems. However, how to efficiently an- alyze and visualize these data to capture essential embedded pattern information is becoming a big challenge today. Classic visualization ap- proaches focus on revealing 2D and 3D spatial information and modeling statistical test. Those methods would easily fail when data become mas- sive. Recent attempts concern on how to simply cluster data and perform prediction with time-oriented information. However, those approaches could still be further enhanced as they also have limitations for han- dling massive clusters and labels. In this paper, we propose a visualiza- tion methodology for mobility data using artificial neural net techniques. This method aggregates three main parts that are Back-end Data Model, Neural Net Algorithm including clustering method Self-Organizing Map (SOM) and prediction approach Recurrent Neural Net (RNN) for ex- tracting the features and lastly a solid front-end that displays the results to users with an interactive system. SOM is able to cluster the visiting patterns and detect the abnormal pattern. RNN can perform the predic- tion for time series analysis using its dynamic architecture. Furthermore, an interactive system will enable user to interpret the result with graph- ics, animation and 3D model for a close-loop feedback. This method can be particularly applied in two tasks that Commercial-based Promotion and abnormal traffic patterns detection.
AI Key Findings
Get AI-generated insights about this paper's methodology, results, significance, and more — seven facets brought into focus.
Impact
Paper Details
PDF Preview
Key Terms
Citation Network
Current paper (gray), citations (green), references (blue)
Display is limited for performance on very large graphs.
Discussion 0