The study defines a neighborhood attribute profile per node by aggregating the direction-specific connections to neighbor industries, normalizes by node degree to remove scale effects, and applies UMAP with cosine distance to project 26-dimensional profiles into 2D for visualization of structural topology.
Visual Analytics of Neighborhood Attribute Profiles for Exploring Structural Equivalence
Publication
Metrics
Quick Answers
What methodology did the authors use?
The study defines a neighborhood attribute profile per node by aggregating the direction-specific connections to neighbor industries, normalizes by node degree to remove scale effects, and applies UMAP with cosine distance to project 26-dimensional profiles into 2D for visualization of structural topology. More in Methodology →
What are the key results?
The 2D manifold shows continuous supply chain transitions (e.g., Steel to AutoParts to Automobiles) rather than discrete clusters, indicating a gradient of structural roles. — Semantic industry labels can be separated in the manifold based on actual transaction networks, revealing divergence between semantics and topology. More in Key Results →
Why is this work significant?
Demonstrates that structural similarity in attributed networks may not align with semantic labels and that manifold topology analysis can reveal true similarity patterns, challenging assumptions used by conventional similarity metrics and embeddings. More in Significance →
What are the main limitations?
Analysis relies on a single large inter-firm network from Japanese datasets; generalizability to other networks remains to be validated. — UMAP projection is visual and qualitative; quantitative measures of structural equivalence along the manifold are not fully formalized in the study. More in Limitations →
Abstract
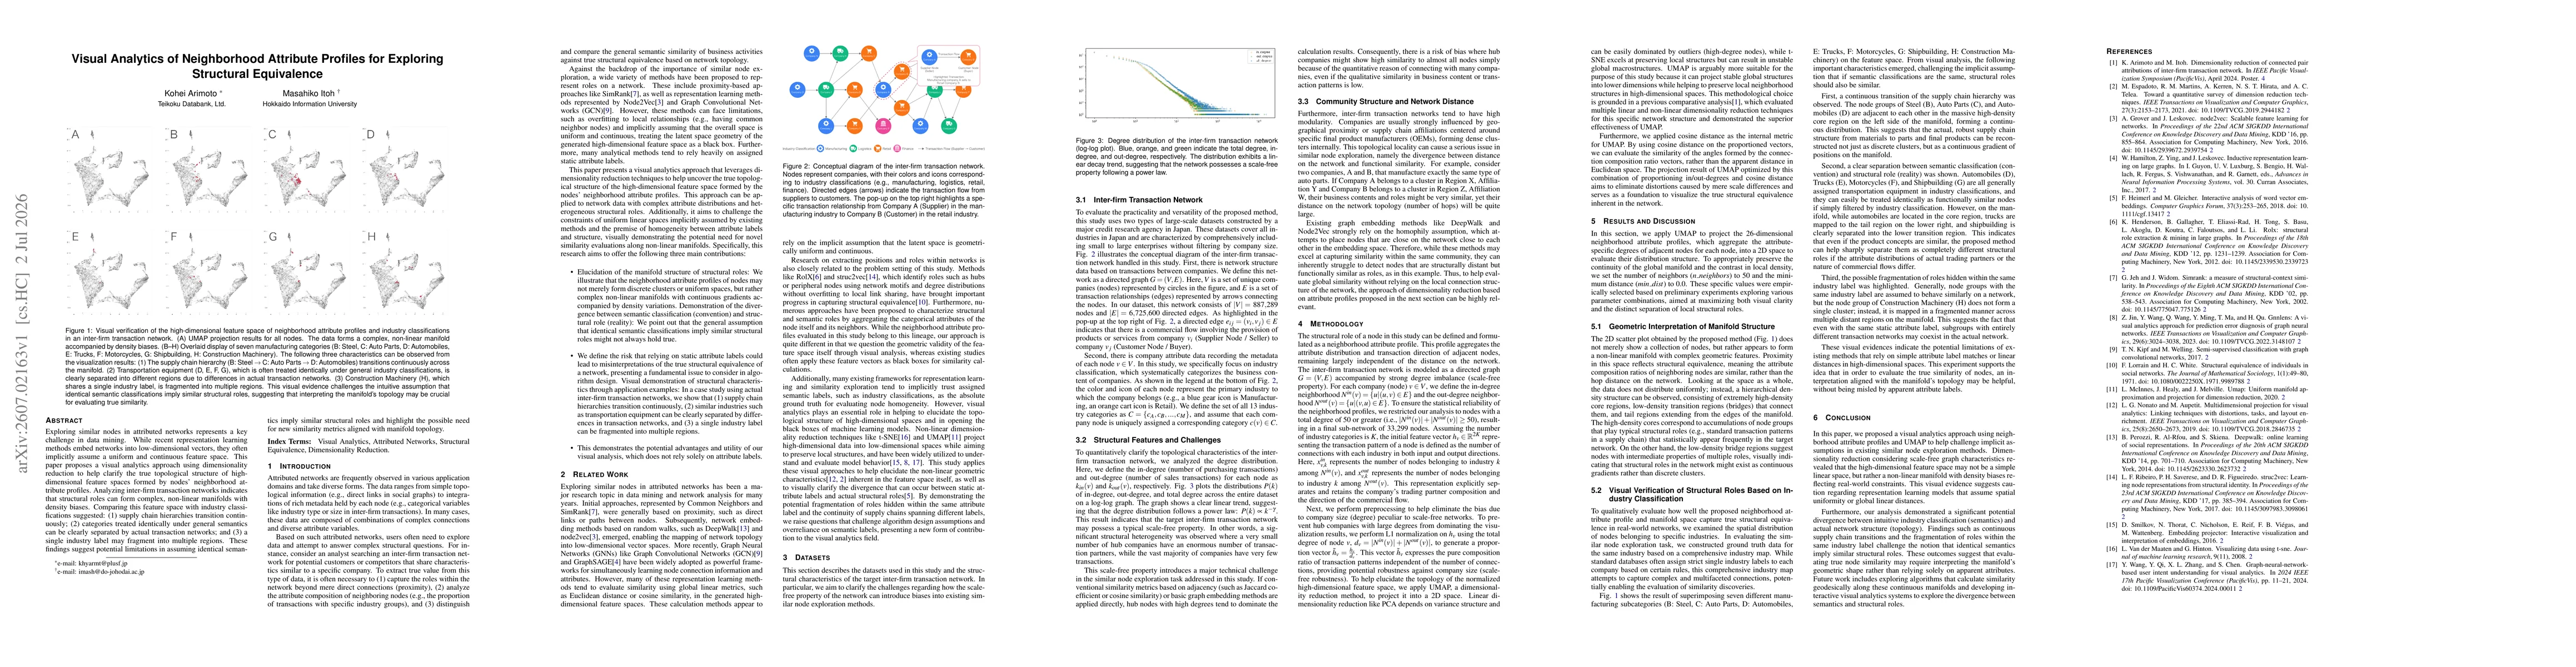
Exploring similar nodes in attributed networks represents a key challenge in data mining. While recent representation learning methods embed networks into low-dimensional vectors, they often implicitly assume a uniform and continuous feature space. This paper proposes a visual analytics approach using dimensionality reduction to help clarify the true topological structure of high-dimensional feature spaces formed by nodes' neighborhood attribute profiles. Analyzing inter-firm transaction networks indicates that structural roles can form complex, non-linear manifolds with density biases. Comparing this feature space with industry classifications suggested: (1) supply chain hierarchies transition continuously; (2) categories treated identically under general semantics can be clearly separated by actual transaction networks; and (3) a single industry label may fragment into multiple regions. These findings suggest potential limitations in assuming identical semantics imply similar structural roles and highlight the possible need for new similarity metrics aligned with manifold topology.
Key Findings, in focus
Seven facets of this paper, analysed and brought into focus by AI.
Demonstrates that structural similarity in attributed networks may not align with semantic labels and that manifold topology analysis can reveal true similarity patterns, challenging assumptions used by conventional similarity metrics and embeddings.
- The 2D manifold shows continuous supply chain transitions (e.g., Steel to AutoParts to Automobiles) rather than discrete clusters, indicating a gradient of structural roles.
- Semantic industry labels can be separated in the manifold based on actual transaction networks, revealing divergence between semantics and topology.
- Same industry label can fragment into multiple manifold regions, suggesting multiple structural roles hidden within a single semantic class.
Demonstrates that structural similarity in attributed networks may not align with semantic labels and that manifold topology analysis can reveal true similarity patterns, challenging assumptions used by conventional similarity metrics and embeddings.
Proposes a novel visual analytics pipeline that converts high-dimensional neighborhood attribute profiles into a 2D manifold using UMAP with cosine distance, enabling direct visual assessment of structural equivalence beyond traditional attribute-label-based metrics.
Introduces the concept that structural roles reside on a complex non-linear manifold with density biases, and demonstrates, via visualization, that identical semantic classifications do not guarantee similar structural roles, highlighting the need for topology-aware similarity metrics.
- Analysis relies on a single large inter-firm network from Japanese datasets; generalizability to other networks remains to be validated.
- UMAP projection is visual and qualitative; quantitative measures of structural equivalence along the manifold are not fully formalized in the study.
- Develop algorithms to compute geodesic-based similarity along the manifold to quantify true structural similarity.
- Create interactive visual analytics tools to explore divergence between semantics and topology across different networks.
- Extend validation to additional datasets and industries to test robustness of the manifold-based approach.
Discussion 0