Visual Boosting Techniques for Spatiotemporal Dense Pixel Visualizations
Publication
Metrics
AI Quick Summary
The paper develops a measure-driven visual analytics approach to reduce distortions when converting 2D spatiotemporal data into a 1D order for dense pixel visualizations. By using neighborhood preservation metrics and visual boosts (glyphs, halos, hatching), it helps analysts distinguish real spatial patterns from artifacts, demonstrated with COVID-19 data across German districts.
Paper Preview
Abstract
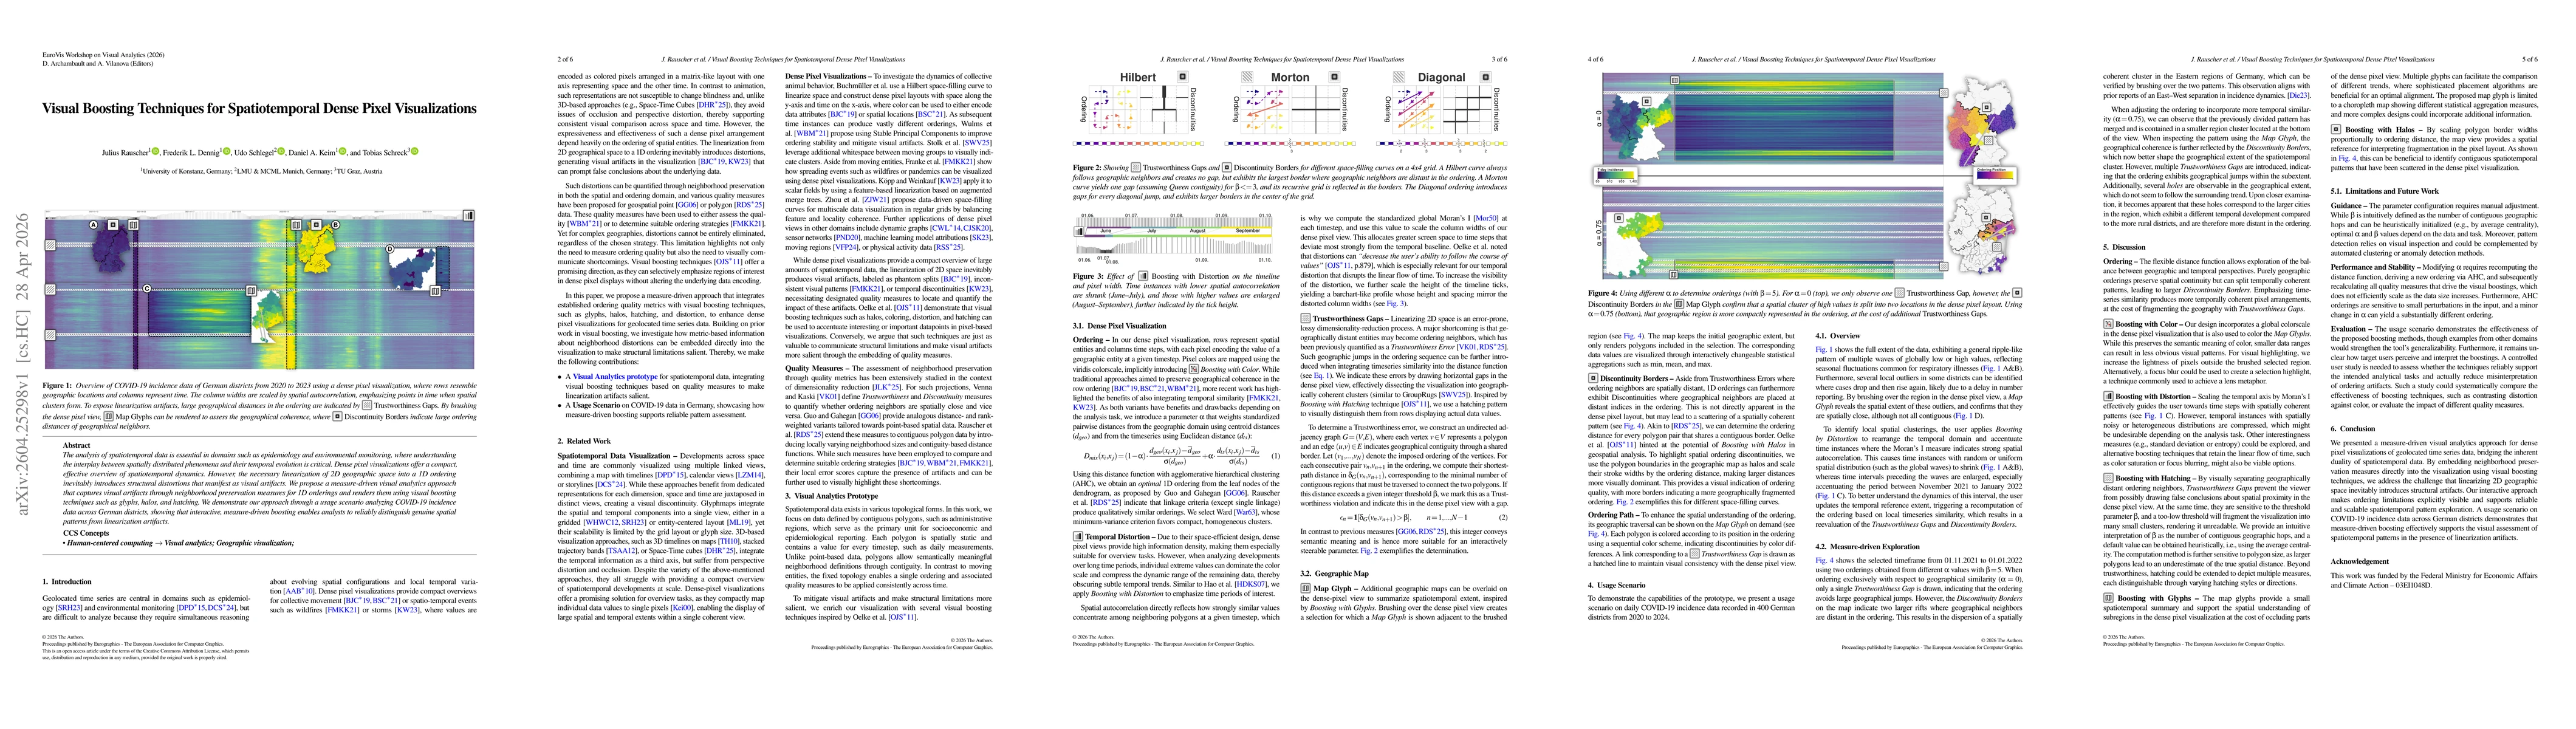
The analysis of spatiotemporal data is essential in domains such as epidemiology and environmental monitoring, where understanding the interplay between spatially distributed phenomena and their temporal evolution is critical. Dense pixel visualizations offer a compact, effective overview of spatiotemporal dynamics. However, the necessary linearization of 2D geographic space into a 1D ordering inevitably introduces structural distortions that manifest as visual artifacts. We propose a measure-driven visual analytics approach that captures visual artifacts through neighborhood preservation measures for 1D orderings and renders them using visual boosting techniques such as glyphs, halos, and hatching. We demonstrate our approach through a usage scenario analyzing COVID-19 incidence data across German districts, showing that interactive, measure-driven boosting enables analysts to reliably distinguish genuine spatial patterns from linearization artifacts.
AI Key Findings
Get AI-generated insights about this paper's methodology, results, significance, and more — seven facets brought into focus.
Discussion 0