Visual Elements and Cognitive Biases Influence Interpretations of Trends in Scatter Plots
Publication
Metrics
AI Quick Summary
This paper examines how visual elements and cognitive biases affect the interpretation of scatter plots, finding that outliers skew trend perception, trend lines amplify perceived trends, and people's beliefs slightly influence weak correlations. Guidelines are proposed to adjust visual elements for clearer interpretations, with implications for other visualization types.
Paper Preview
Abstract
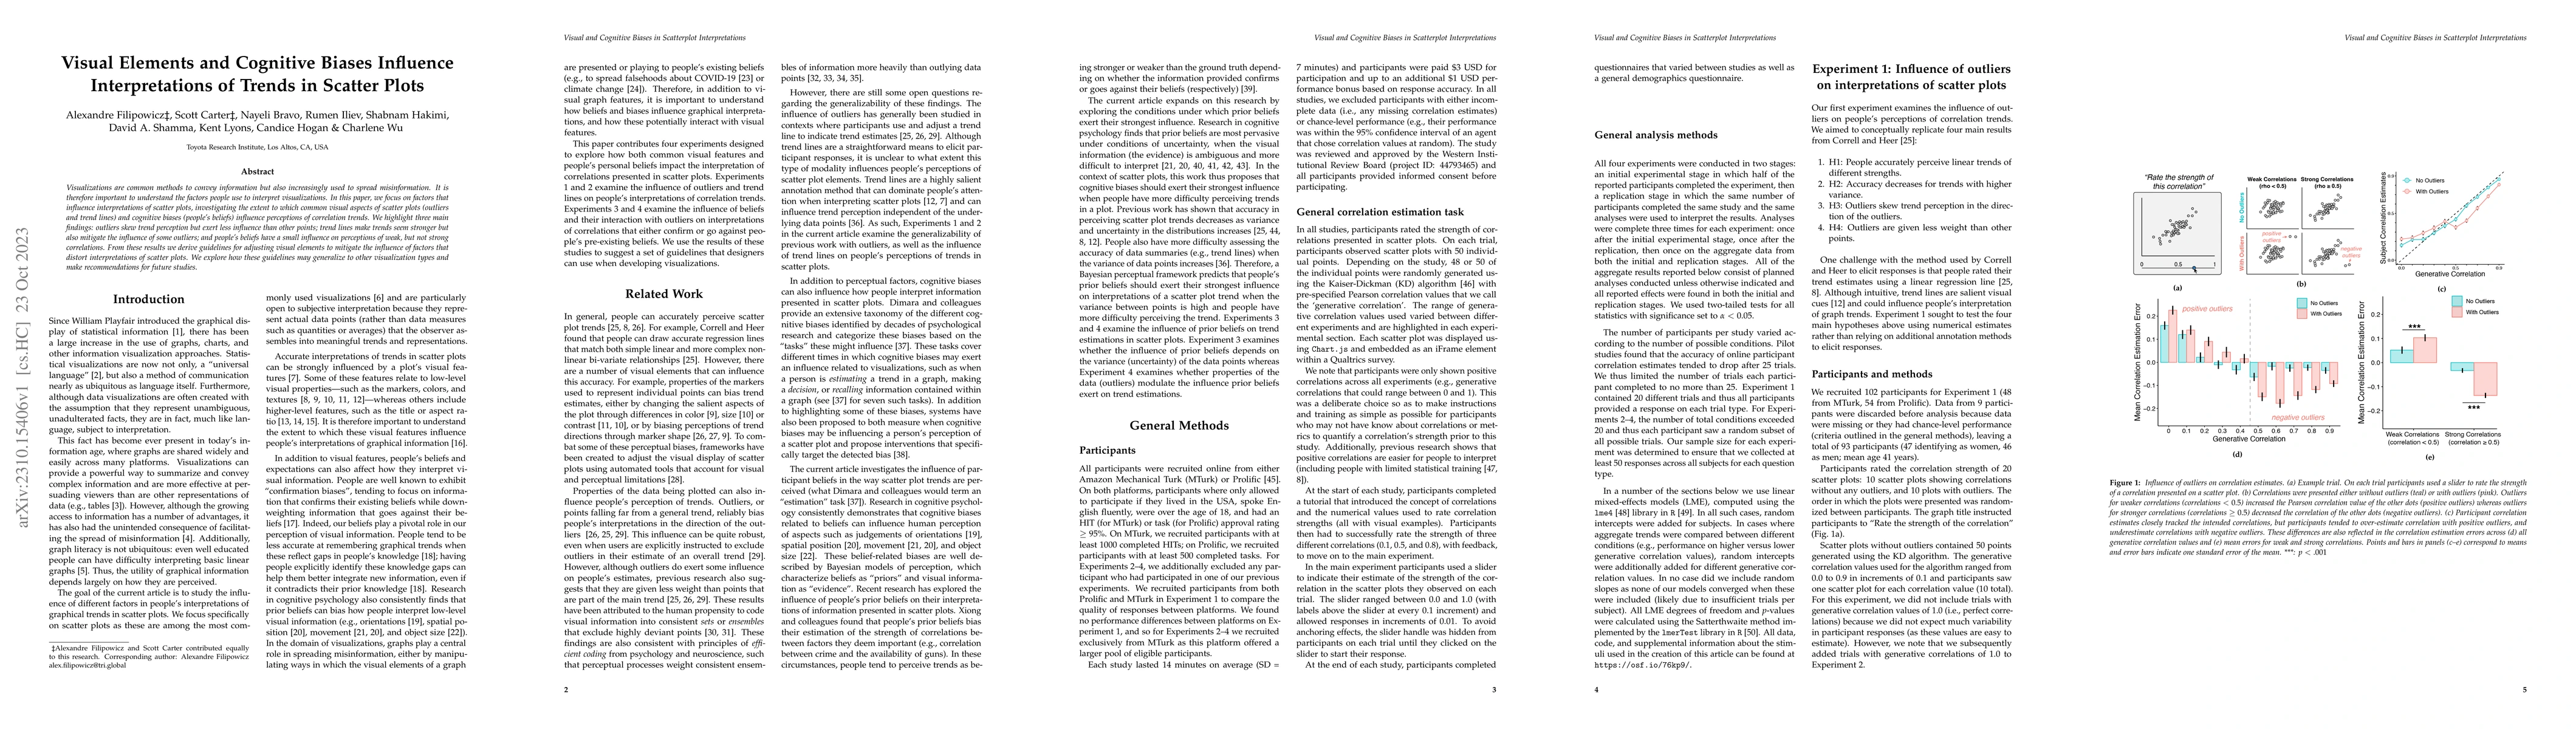
Visualizations are common methods to convey information but also increasingly used to spread misinformation. It is therefore important to understand the factors people use to interpret visualizations. In this paper, we focus on factors that influence interpretations of scatter plots, investigating the extent to which common visual aspects of scatter plots (outliers and trend lines) and cognitive biases (people's beliefs) influence perception of correlation trends. We highlight three main findings: outliers skew trend perception but exert less influence than other points; trend lines make trends seem stronger but also mitigate the influence of some outliers; and people's beliefs have a small influence on perceptions of weak, but not strong correlations. From these results we derive guidelines for adjusting visual elements to mitigate the influence of factors that distort interpretations of scatter plots. We explore how these guidelines may generalize to other visualization types and make recommendations for future studies.
AI Key Findings
Get AI-generated insights about this paper's methodology, results, significance, and more — seven facets brought into focus.
Impact
Paper Details
Authors
PDF Preview
Key Terms
Citation Network
Current paper (gray), citations (green), references (blue)
Display is limited for performance on very large graphs.
Discussion 0