Visual Harmony: Text-Visual Interplay in Circular Infographics
Publication
Metrics
AI Quick Summary
This study explores how text placement and descriptiveness affect the pleasantness, comprehension, and memorability of circular infographics. Findings suggest that embedding text and using simplistic descriptions can enhance memorability and pleasantness, providing useful guidelines for effective infographic design.
Paper Preview
Abstract
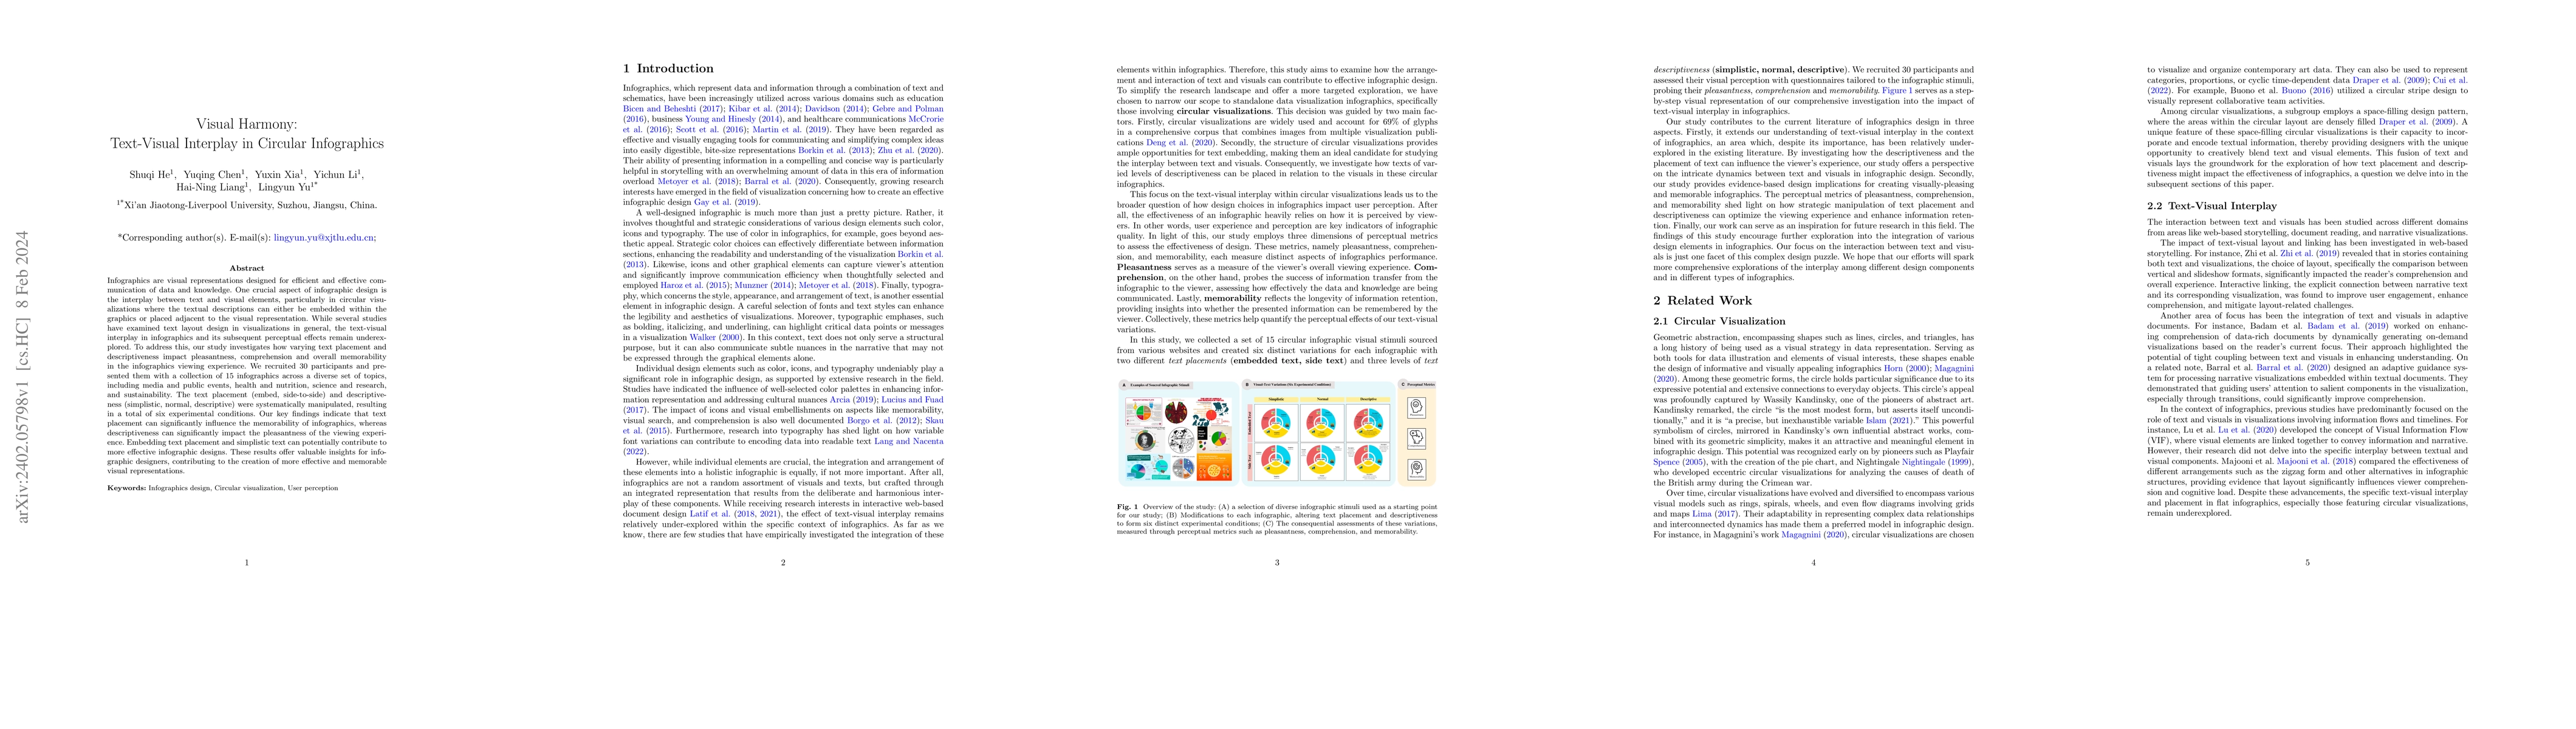
Infographics are visual representations designed for efficient and effective communication of data and knowledge. One crucial aspect of infographic design is the interplay between text and visual elements, particularly in circular visualizations where the textual descriptions can either be embedded within the graphics or placed adjacent to the visual representation. While several studies have examined text layout design in visualizations in general, the text-visual interplay in infographics and its subsequent perceptual effects remain underexplored. To address this, our study investigates how varying text placement and descriptiveness impact pleasantness, comprehension and overall memorability in the infographics viewing experience. We recruited 30 participants and presented them with a collection of 15 infographics across a diverse set of topics, including media and public events, health and nutrition, science and research, and sustainability. The text placement (embed, side-to-side) and descriptiveness (simplistic, normal, descriptive) were systematically manipulated, resulting in a total of six experimental conditions. Our key findings indicate that text placement can significantly influence the memorability of infographics, whereas descriptiveness can significantly impact the pleasantness of the viewing experience. Embedding text placement and simplistic text can potentially contribute to more effective infographic designs. These results offer valuable insights for infographic designers, contributing to the creation of more effective and memorable visual representations.
AI Key Findings
Get AI-generated insights about this paper's methodology, results, significance, and more — seven facets brought into focus.
Impact
Paper Details
Authors
PDF Preview
Key Terms
Citation Network
Current paper (gray), citations (green), references (blue)
Display is limited for performance on very large graphs.
Discussion 0