ArxivLens

Quick Summary:

This paper proposes a computational method to automatically extract representative textual and visual elements from infographics, termed visual hashtags, using a two-step approach: first predicting text tags from the infographic's text, and then using these tags to identify key visual elements. The method is evaluated on a dataset of 29K infographics across 26 categories and 391 tags.

arXiv Id: 1709.09215
Date Published: 2017-09-28
Date Updated: 2017-09-28

Categories:

Key Terms (TF-IDF):

visual (0.364)
diagnostic (0.275)
text (0.257)
elements (0.249)
content (0.224)
predicted (0.215)
textual (0.173)
annotations (0.170)
sampled (0.165)
performances (0.160)
outputs (0.158)
extracting (0.157)
representative (0.154)
topic (0.154)
automated (0.147)
categories (0.144)
label (0.142)
automatically (0.138)
discovery (0.135)
extract (0.134)
License: http://arxiv.org/licenses/nonexclusive-distrib/1.0/

Summary:

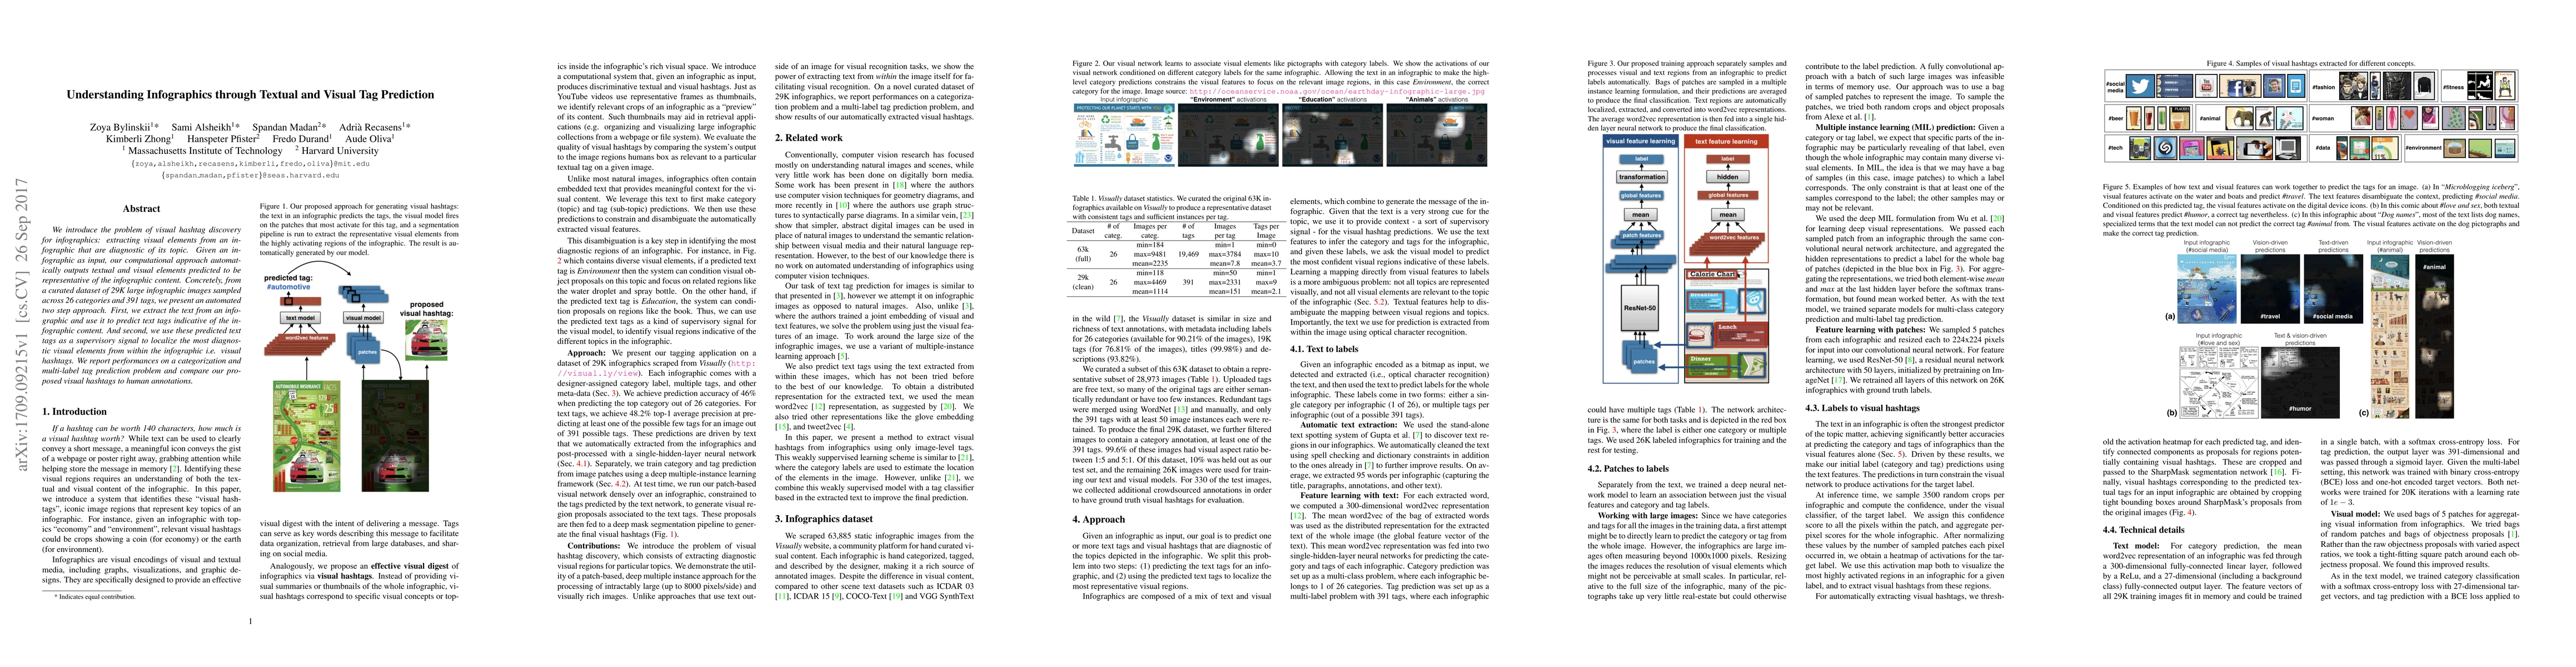
We introduce the problem of visual hashtag discovery for infographics: extracting visual elements from an infographic that are diagnostic of its topic. Given an infographic as input, our computational approach automatically outputs textual and visual elements predicted to be representative of the infographic content. Concretely, from a curated dataset of 29K large infographic images sampled across 26 categories and 391 tags, we present an automated two step approach. First, we extract the text from an infographic and use it to predict text tags indicative of the infographic content. And second, we use these predicted text tags as a supervisory signal to localize the most diagnostic visual elements from within the infographic i.e. visual hashtags. We report performances on a categorization and multi-label tag prediction problem and compare our proposed visual hashtags to human annotations.

Citation & Reference Network Visualization

This graph shows how this paper is connected to other research. The current paper is shown in dark gray, papers that cite it are in green, and papers it references are in blue. You can:

Current Paper
Papers citing this work (Citations)
Papers cited by this work (References)

• Hover over any node to see the paper title

• Click a node to view that paper's details

• Drag nodes to rearrange the graph

• Use the zoom controls (bottom right) to zoom in/out

Citations and References

Title Authors Year Actions
Same Data, Diverging Perspectives: The Power of Visualizations to Elicit Competing Interpretations
Cindy Xiong Bearfield, Lisanne Van Weelden, Adam Waytz, Steven Franconeri
2024
View Paper
Investigation of the use of infographics to aid second language vocabulary learning
Amjaad Mansour Alwadei, M. Mohsen
2023
View Paper
Jobicon:A Job Icon Dataset for Concept Recognition by Understanding Compositionality
Sooyeon Park, Hyunseo Park, Hyuntak Kim, Yongsang Yoo, Min Song
2023
View Paper
An intelligent approach to automatically discovering visual insights
Yuhua Zhou, Xiyu Meng, Yanhong Wu, Tan Tang, Yongheng Wang, Yingcai Wu
2022
View Paper
Infographics Wizard: Flexible Infographics Authoring and Design Exploration
Anjul Tyagi, J. Zhao, Pushkar Patel, Swasti Khurana, Klaus Mueller
2022
View Paper
Review of Visual Saliency Prediction: Development Process from Neurobiological Basis to Deep Models
Fei Yan, Cheng Chen, Peng Xiao, Siyu Qi, Zhiliang Wang, Ruoxiu Xiao
2021
View Paper
Graph-Based Information Block Detection in Infographic with Gestalt Organization Principles
Jie Lin, Yi Cai, Xin Wu, Jianwei Lu
2021
View Paper
A Mixed-Initiative Approach to Reusing Infographie Charts
Weiwei Cui, Jinpeng Wang, He Huang, Yun Wang, Chin-Yew Lin, Haidong Zhang, Dongmei Zhang
2021
View Paper
VizSnippets: Compressing Visualization Bundles Into Representative Previews for Browsing Visualization Collections
Michael Oppermann, T. Munzner
2021
View Paper
Towards Natural Language Interfaces for Data Visualization: A Survey
Leixian Shen, Enya Shen, Yuyu Luo, Xiaocong Yang, Xuming Hu, Xiongshuai Zhang, Zhiwei Tai, Jianmin Wang
2021
View Paper
User-Centric Semi-Automated Infographics Authoring and Recommendation
Anjul Tyagi, Jian Zhao, Pushkar Patel, Swasti Khurana, Klaus Mueller
2021
View Paper
InfographicVQA
Minesh Mathew, Viraj Bagal, Rubèn Pérez Tito, Dimosthenis Karatzas, Ernest Valveny, C.V. Jawahar
2021
View Paper
Learning Multimodal Affinities for Textual Editing in Images
Or Perel, Oron Anschel, Omri Ben-Eliezer, Shai Mazor, Hadar Averbuch-Elor
2021
View Paper
InfoColorizer: Interactive Recommendation of Color Palettes for Infographics
Linping Yuan, Ziqi Zhou, Jian Zhao, Yiqiu Guo, F. Du, Huamin Qu
2021
View Paper
A Survey on ML4VIS: Applying Machine Learning Advances to Data Visualization
Qianwen Wang, Zhutian Chen, Yong Wang, Huamin Qu
2020
View Paper
Applying Machine Learning Advances to Data Visualization: A Survey on ML4VIS
Qianwen Wang, Zhutian Chen, Yong Wang, Huamin Qu
2020
View Paper
Chartem: Reviving Chart Images with Data Embedding
Jiayun Fu, B. Zhu, Weiwei Cui, Song Ge, Yun Wang, Haidong Zhang, He Huang, Yuanyuan Tang, Dongmei Zhang, Xiaojing Ma
2020
View Paper
A survey on automatic infographics and visualization recommendations
Sujia Zhu, Guodao Sun, Qi Jiang, Meng Zha, Ronghua Liang
2020
View Paper
From Lost to Found
Chunyang Chen, Sidong Feng, Zhengyang Liu, Zhenchang Xing, Shengdong Zhao
2020
View Paper
Predicting Visual Importance Across Graphic Design Types
Camilo Luciano Fosco, Vincent Casser, A. K. Bedi, Peter O'Donovan, Aaron Hertzmann, Z. Bylinskii
2020
View Paper
Retrieve-Then-Adapt: Example-based Automatic Generation for Proportion-related Infographics
Chunyao Qian, Shizhao Sun, Weiwei Cui, Jian-Guang Lou, Haidong Zhang, Dongmei Zhang
2020
View Paper
Exploring Visual Information Flows in Infographics
Min Lu, Chufeng Wang, J. Lanir, Nanxuan Zhao, H. Pfister, D. Cohen-Or, Hui Huang
2020
View Paper
Interpreting the Rhetoric of Visual Advertisements
Keren Ye, Narges Honarvar Nazari, James Hahn, Zaeem Hussain, Mingda Zhang, Adriana Kovashka
2019
View Paper
Saliency Prediction in the Deep Learning Era: Successes and Limitations
A. Borji
2019
View Paper
Visualization Assessment: A Machine Learning Approach
Xin Fu, Yun Wang, Haoyu Dong, Weiwei Cui, Haidong Zhang
2019
View Paper
Towards Automated Infographic Design: Deep Learning-based Auto-Extraction of Extensible Timeline
Zhutian Chen, Yun Wang, Qianwen Wang, Yong Wang, Huamin Qu
2019
View Paper
Text-to-Viz: Automatic Generation of Infographics from Proportion-Related Natural Language Statements
Weiwei Cui, Xiaoyu Zhang, Yun Wang, He Huang, B. Chen, Lei Fang, Haidong Zhang, Jian-Guang Lou, Dongmei Zhang
2019
View Paper
Serif or Sans: Visual Font Analytics on Book Covers and Online Advertisements
Yuto Shinahara, Takuro Karamatsu, Daisuke Harada, Kota Yamaguchi, S. Uchida
2019
View Paper
Variational Prototyping-Encoder: One-Shot Learning With Prototypical Images
Junsik Kim, Tae-Hyun Oh, Seokju Lee, Fei Pan, In-So Kweon
2019
View Paper
Measuring Effectiveness of Video Advertisements
James Hahn, Adriana Kovashka
2019
View Paper
Evaluating ‘Graphical Perception’ with CNNs
D. Haehn, J. Tompkin, H. Pfister
2018
View Paper
Saliency Prediction in the Deep Learning Era: An Empirical Investigation
A. Borji
2018
View Paper
Saliency Prediction in the Deep Learning Era: Successes, Limitations, and Future Challenges
A. Borji
2018
View Paper
Parsing and Summarizing Infographics with Synthetically Trained Icon Detection
Spandan Madan, Z. Bylinskii, Matthew Tancik, Adrià Recasens, Kimberli Zhong, Sami Alsheikh, H. Pfister, A. Oliva, F. Durand
2018
View Paper
Separating Self-Expression and Visual Content in Hashtag Supervision
Andreas Veit, Maximilian Nickel, Serge J. Belongie, L. Maaten
2017
View Paper
ADVISE: Symbolism and External Knowledge for Decoding Advertisements
Keren Ye, Adriana Kovashka
2017
View Paper
The Why and The How: A Survey on Natural Language Interaction in Visualization
Henrik Voigt, Ozge Alacam, M. Meuschke, K. Lawonn, Sina Zarrieß
2022
View Paper
Towards Abstractive Captioning of Infographics
Nathan Landman
2018
View Paper
Regression Linear Loss : MSE Convolutional Neural Network Convolutional Activation Maps for Pie Chart Convolutional Activation Maps for Bar Chart Results
D. Haehn, J. Tompkin, H. Pfister
2018
View Paper
Learning to draw vector graphics : applying generative modeling to font glyphs
Kimberli Zhong
2018
View Paper

Similar Papers

Visual Harmony: Text-Visual Interplay in Circular Infographics

Shuqi He, Lingyun Yu, Yuxin Xia, Hai-Ning Liang, Yuqing Chen, Yichun Li

Published: 2024-02-09

The Language of Infographics: Toward Understanding Conceptual Metaphor Use in Scientific Storytelling

Tobias Isenberg, Barbora Kozlíková, Hana Pokojná, Stefan Bruckner, Laura Garrison

Published: 2024-07-18

Synthetically Trained Icon Proposals for Parsing and Summarizing Infographics

Hanspeter Pfister, Spandan Madan, Aude Oliva, Fredo Durand, Matthew Tancik, Zoya Bylinskii, Adrià Recasens, Kimberli Zhong, Sami Alsheikh

Published: 2024-01-01

Comments (0)

This website uses cookies to ensure you get the best experience. Learn more