Visualisation for Exploratory Modelling Analysis of Bayesian Hierarchical Models
Publication
Metrics
AI Quick Summary
This paper proposes new visualisations to facilitate the selection of appropriate hierarchical structures in Bayesian models, demonstrating their utility through the analysis of five models assessing country mathematics trends from the PISA database, thereby aiding informed model choice and effective communication of rationale.
Paper Preview
Abstract
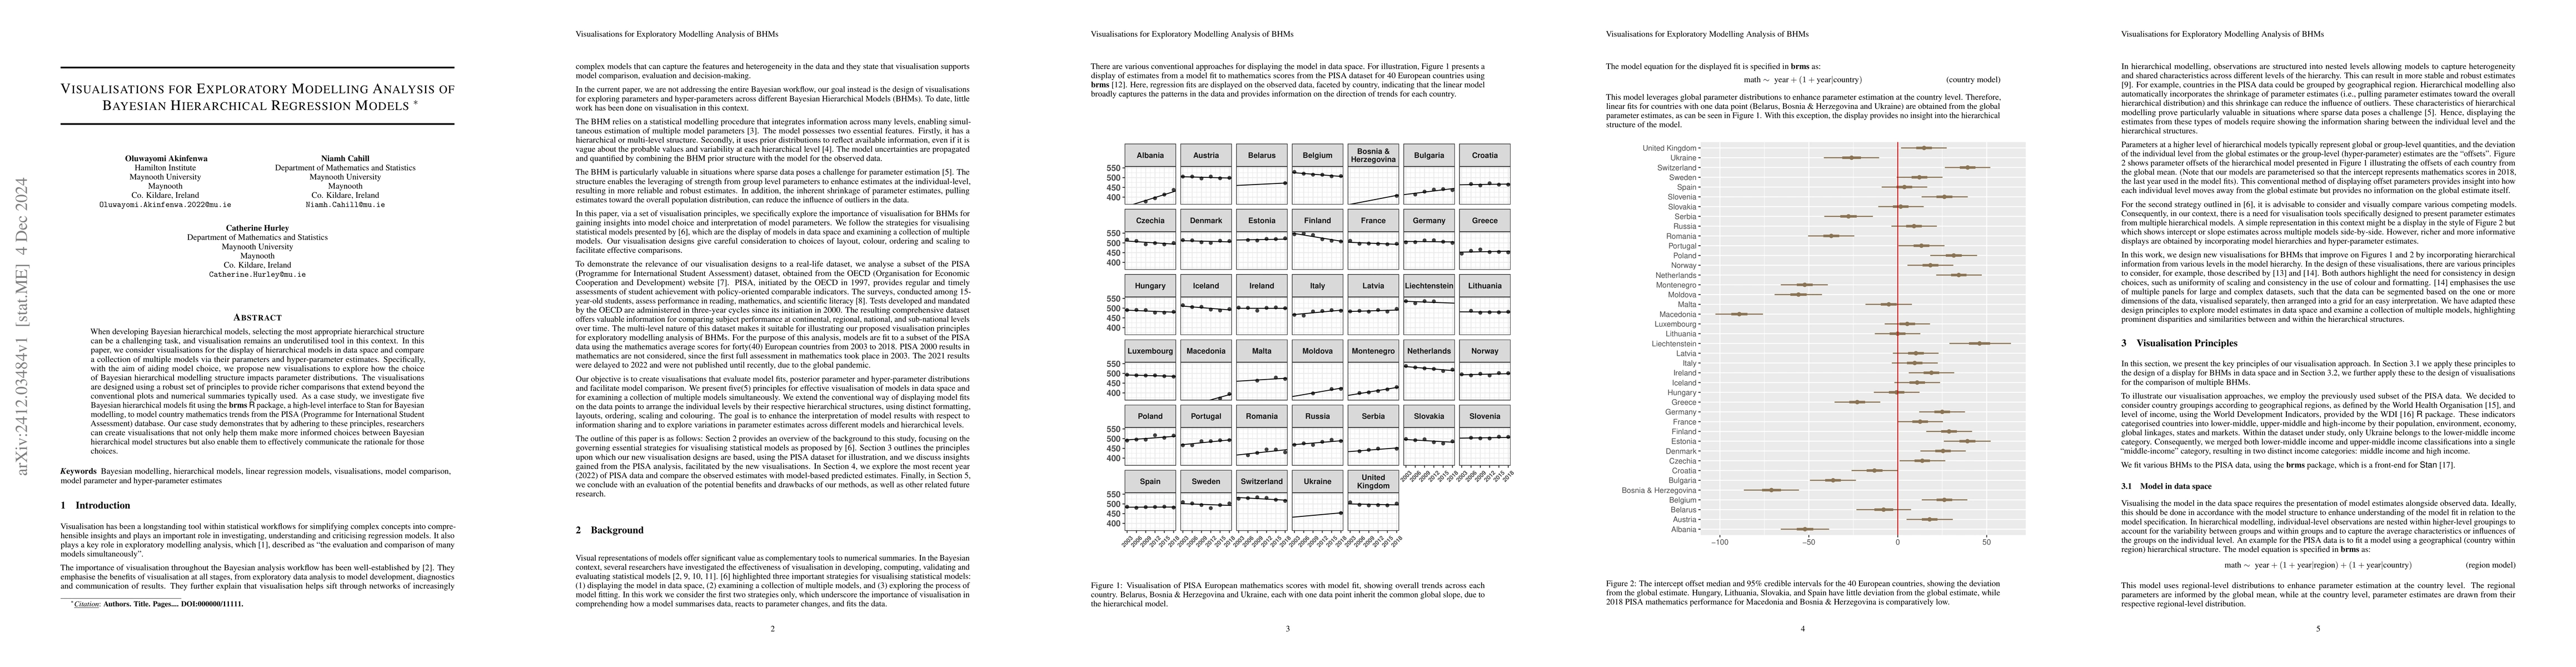
When developing Bayesian hierarchical models, selecting the most appropriate hierarchical structure can be a challenging task, and visualisation remains an underutilised tool in this context. In this paper, we consider visualisations for the display of hierarchical models in data space and compare a collection of multiple models via their parameters and hyper-parameter estimates. Specifically, with the aim of aiding model choice, we propose new visualisations to explore how the choice of Bayesian hierarchical modelling structure impacts parameter distributions. The visualisations are designed using a robust set of principles to provide richer comparisons that extend beyond the conventional plots and numerical summaries typically used. As a case study, we investigate five Bayesian hierarchical models fit using the brms R package, a high-level interface to Stan for Bayesian modelling, to model country mathematics trends from the PISA (Programme for International Student Assessment) database. Our case study demonstrates that by adhering to these principles, researchers can create visualisations that not only help them make more informed choices between Bayesian hierarchical model structures but also enable them to effectively communicate the rationale for those choices.
AI Key Findings
Get AI-generated insights about this paper's methodology, results, significance, and more — seven facets brought into focus.
Authors
PDF Preview
Related Papers
No references found for this paper.
Discussion 0