Academic Profile
Statistics
Similar Authors
Papers on arXiv
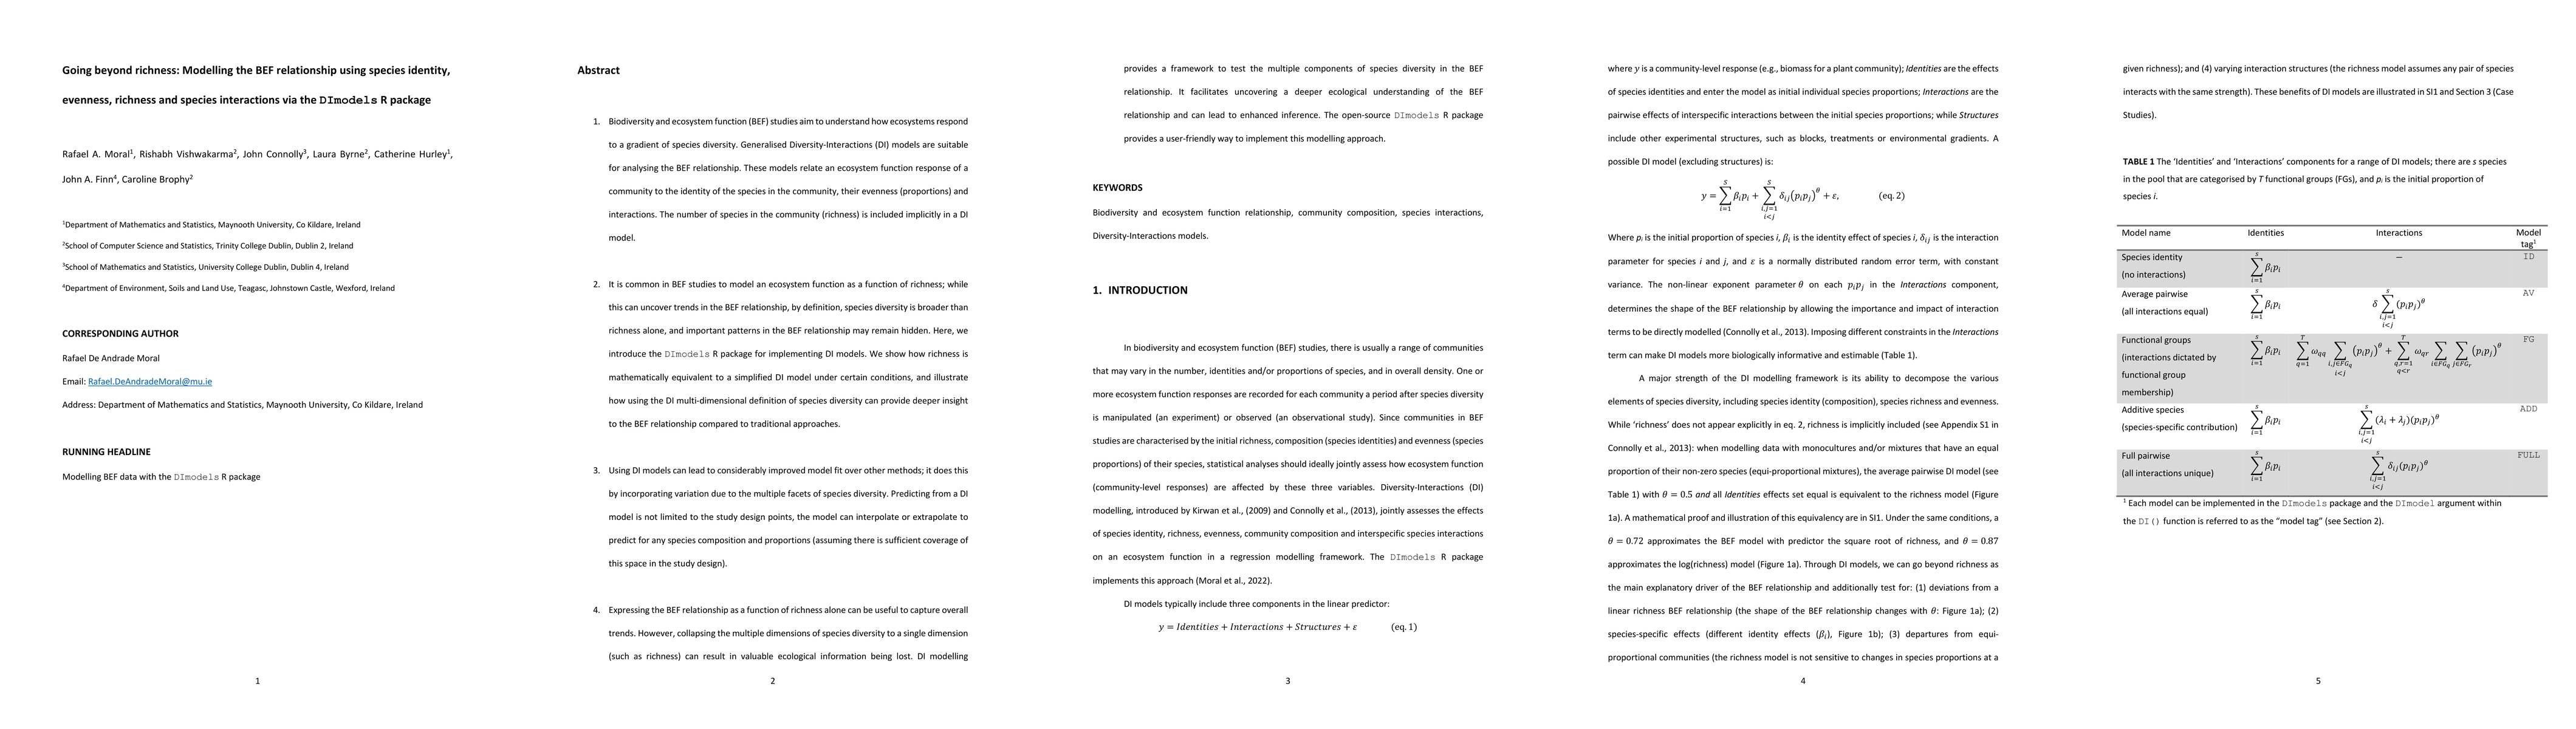
BEF studies aim to understand how ecosystems respond to a gradient of species diversity. Diversity-Interactions (DI) models are suitable for analysing the BEF relationship. These models relate an ec...
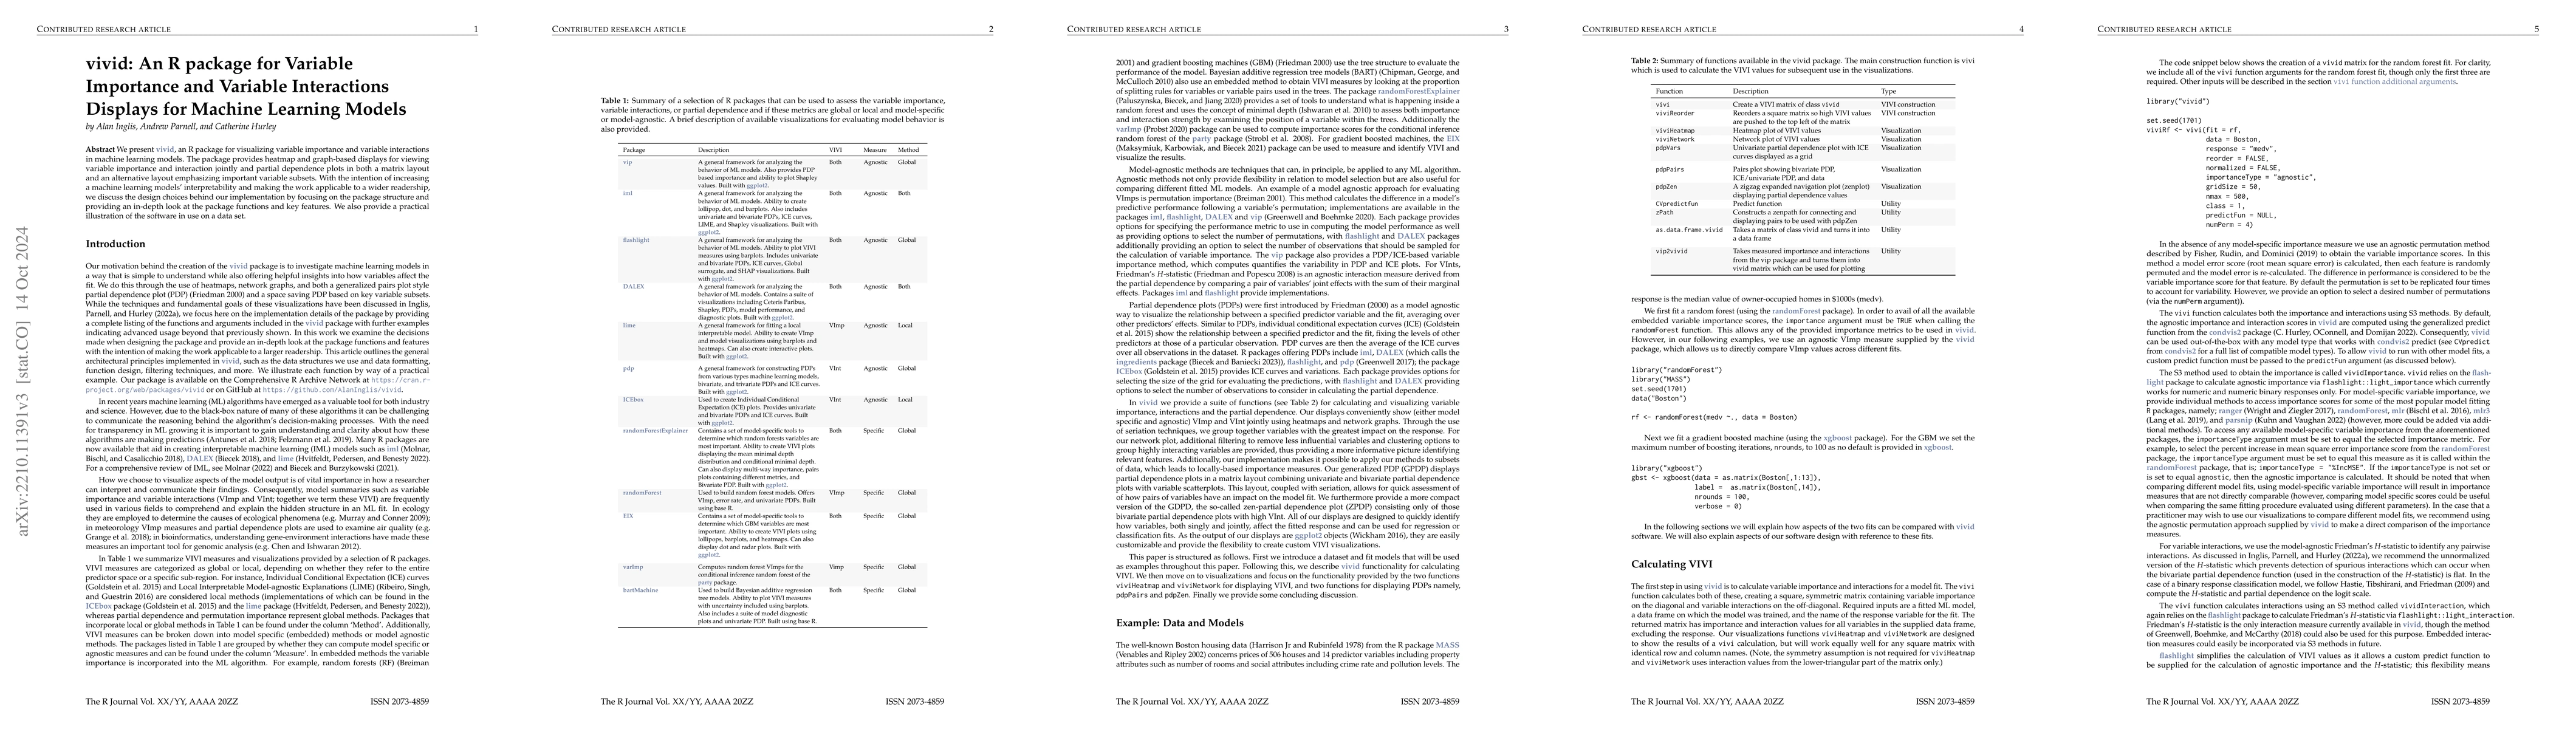
We present vivid, an R package for visualizing variable importance and variable interactions in machine learning models. The package provides a range of displays including heatmap and graph-based di...
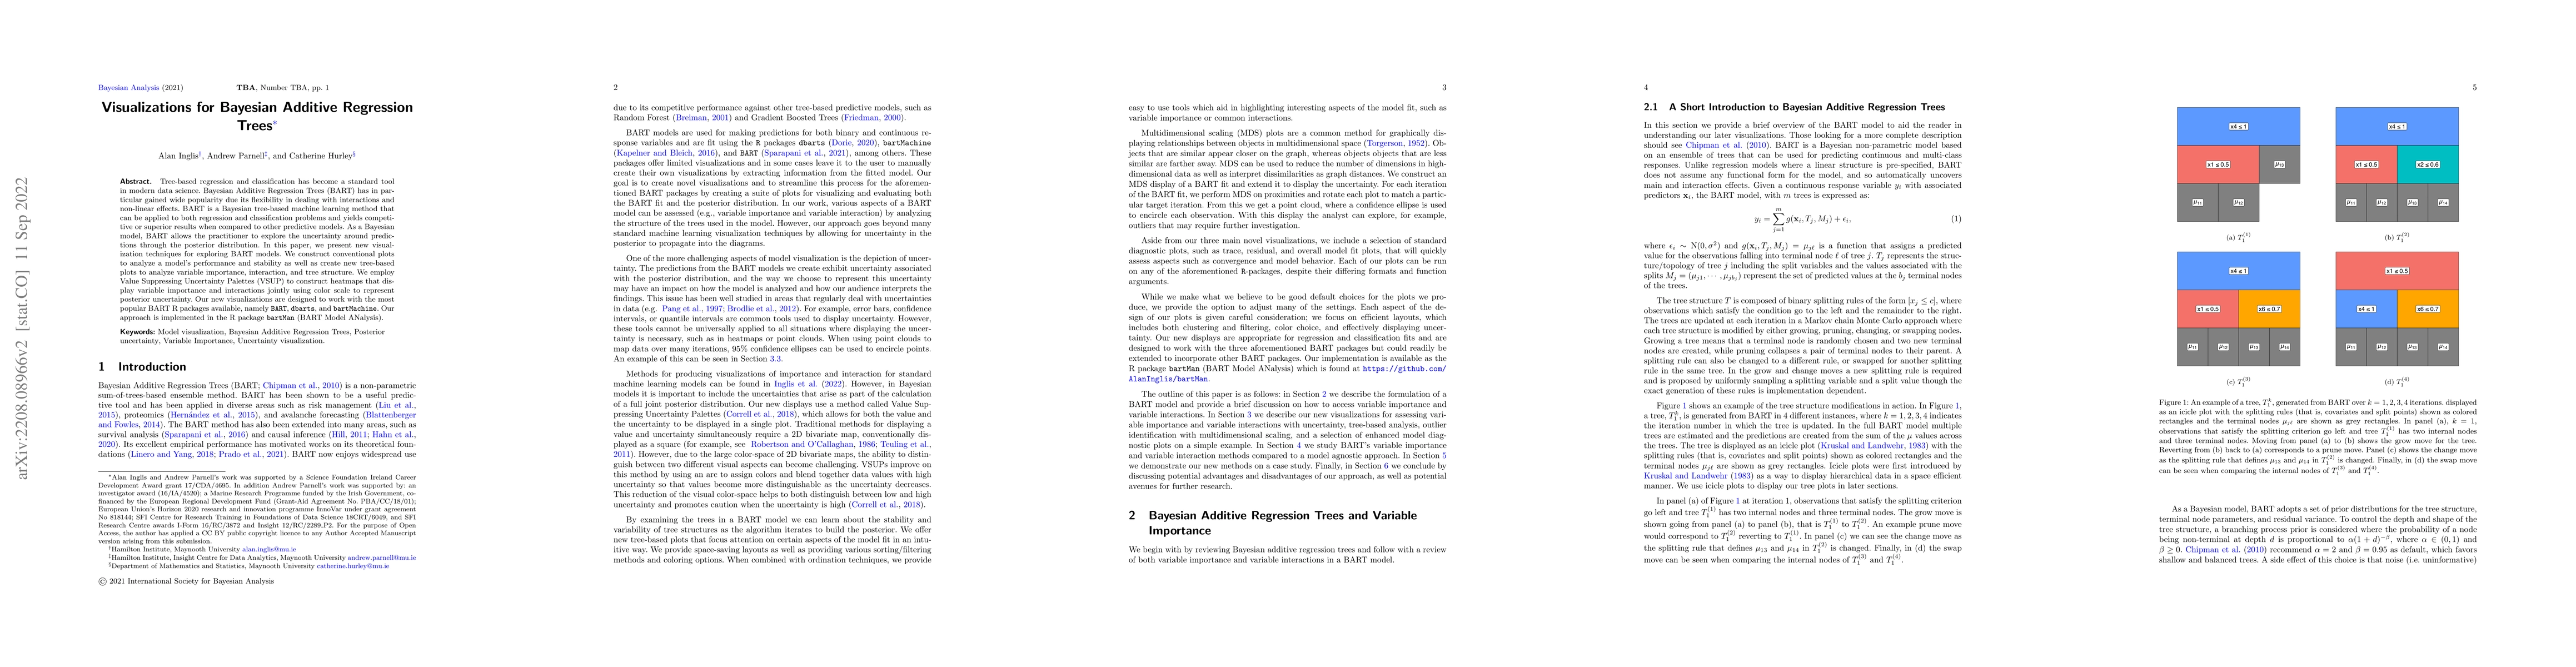
Tree-based regression and classification has become a standard tool in modern data science. Bayesian Additive Regression Trees (BART) has in particular gained wide popularity due its flexibility in ...
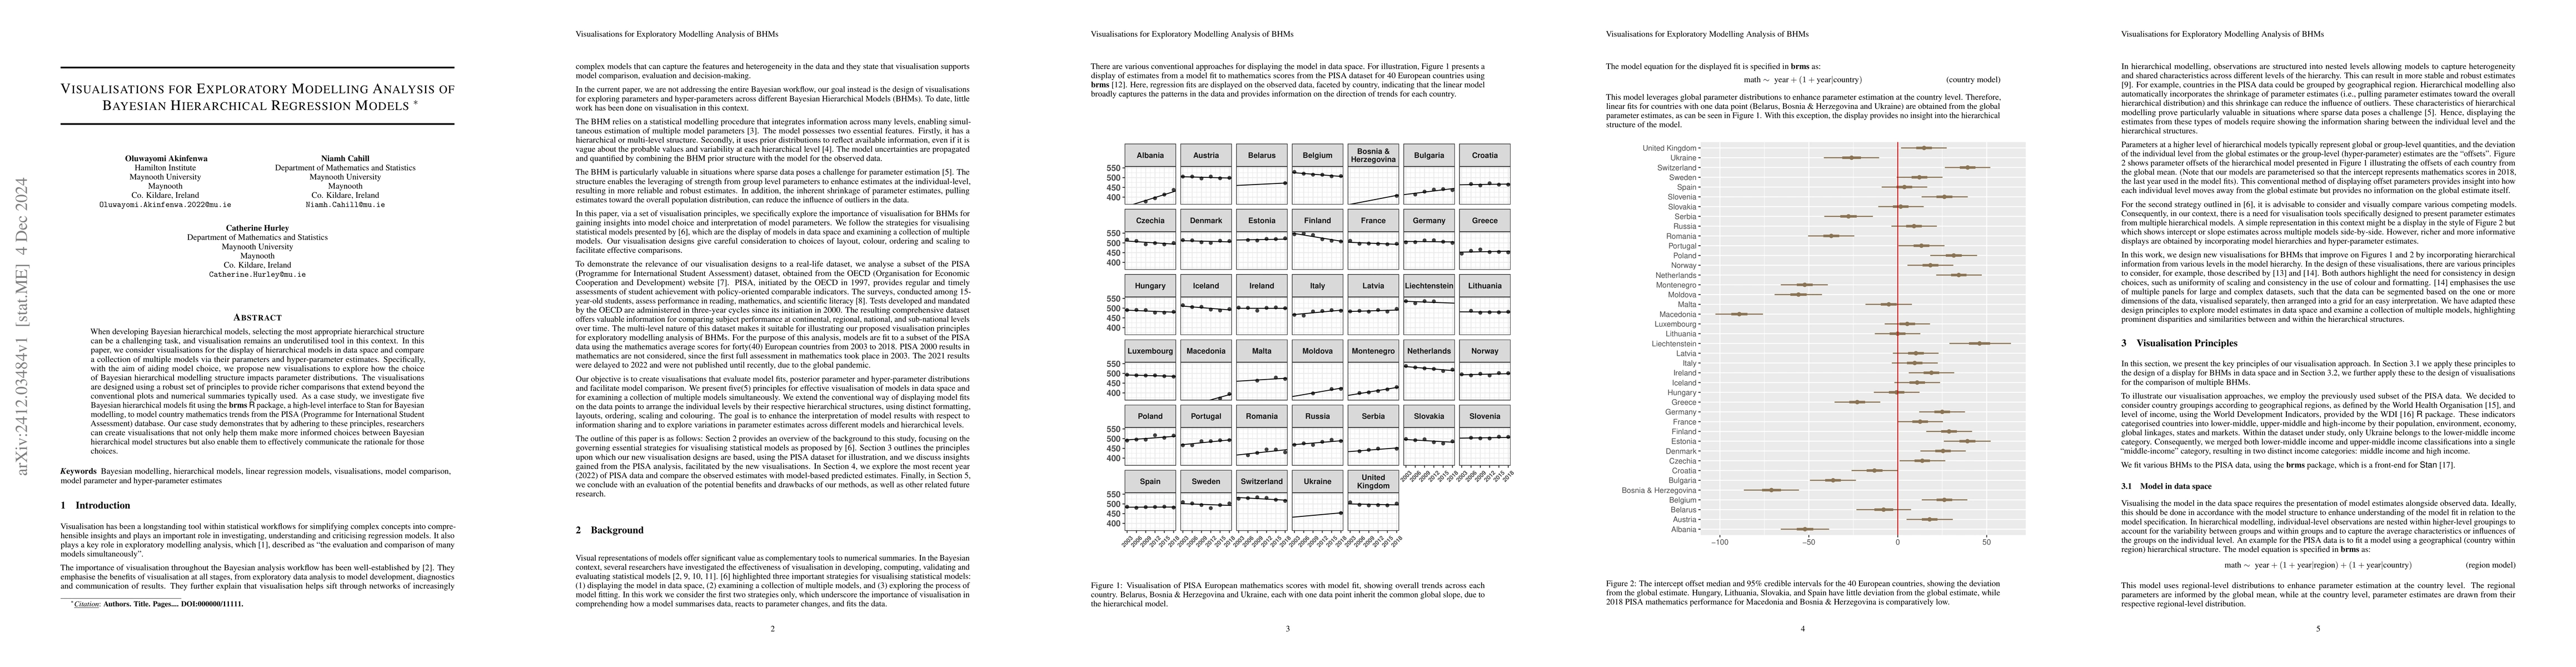
When developing Bayesian hierarchical models, selecting the most appropriate hierarchical structure can be a challenging task, and visualisation remains an underutilised tool in this context. In this ...
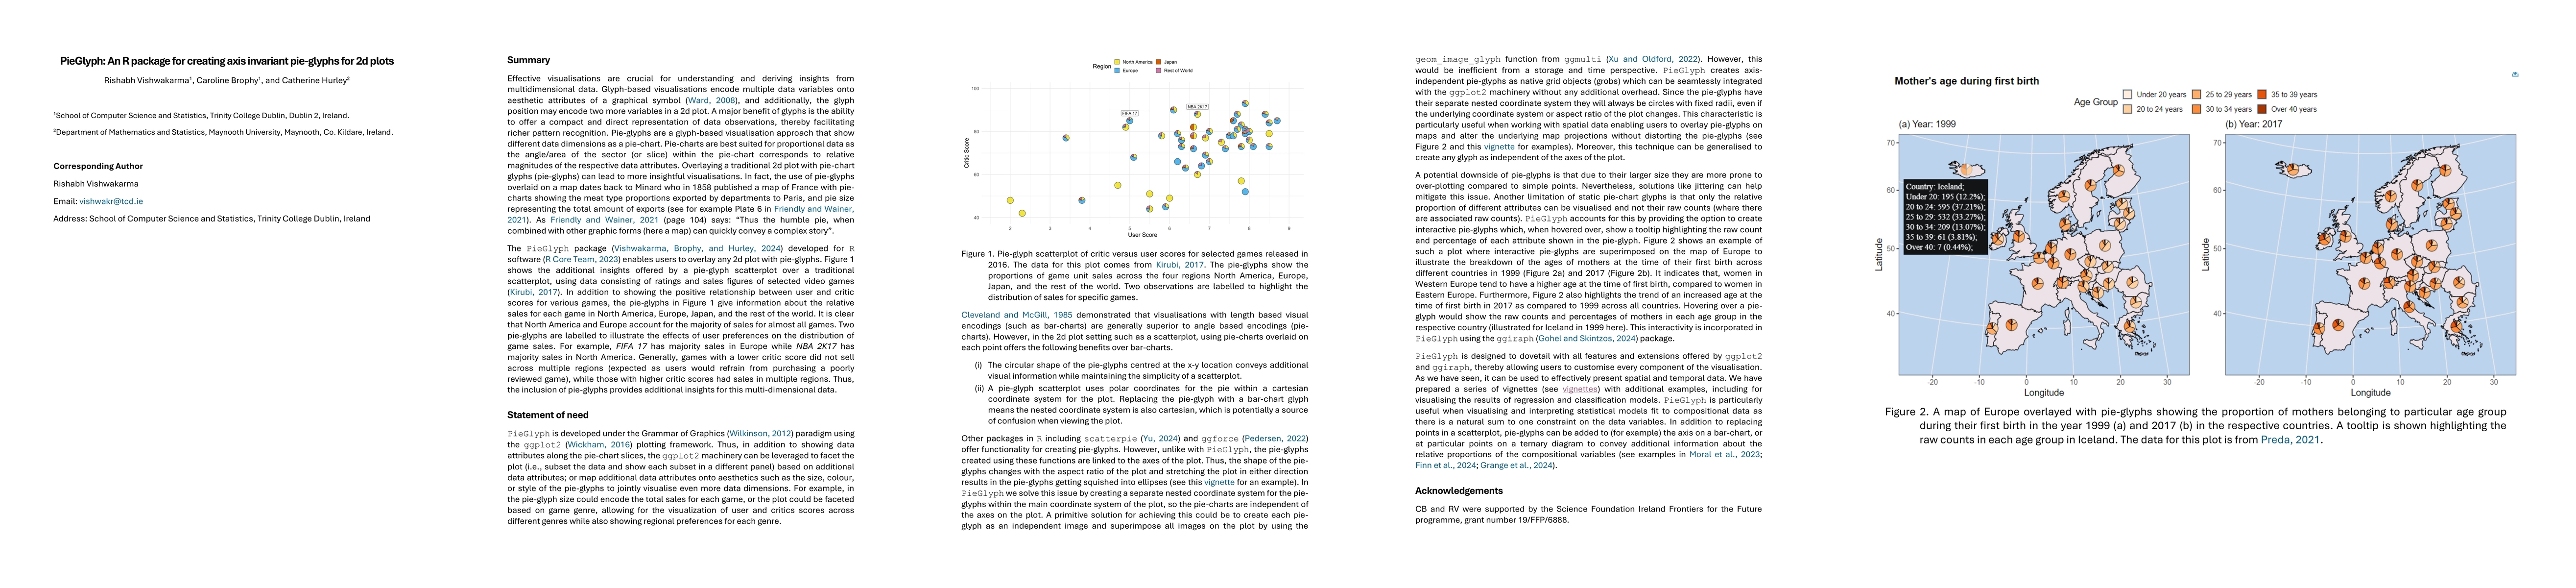
Effective visualisation of multidimensional data is crucial for generating insights. Glyph-based visualisations, which encode data dimensions onto multiple visual channels such as colour, shape, and s...
The World Development Indicators (WDI) database provides a wide range of global development data, maintained and published by the World Bank. Our \textit{wdiexplorer} package offers a comprehensive wo...
Family planning is a global development priority and a key indicator of reproductive health. Monitoring progress is challenged by gaps in survey data across countries. The United Nations Population Di...