vivid: An R package for Variable Importance and Variable Interactions Displays for Machine Learning Models
Publication
Metrics
AI Quick Summary
The vivid R package facilitates visualization of variable importance and interactions in machine learning models, offering heatmaps, graph-based displays, and partial dependence plots. It aims to enhance model interpretability and accessibility, with an in-depth look at its design and practical application demonstrated on a dataset.
Paper Preview
Abstract
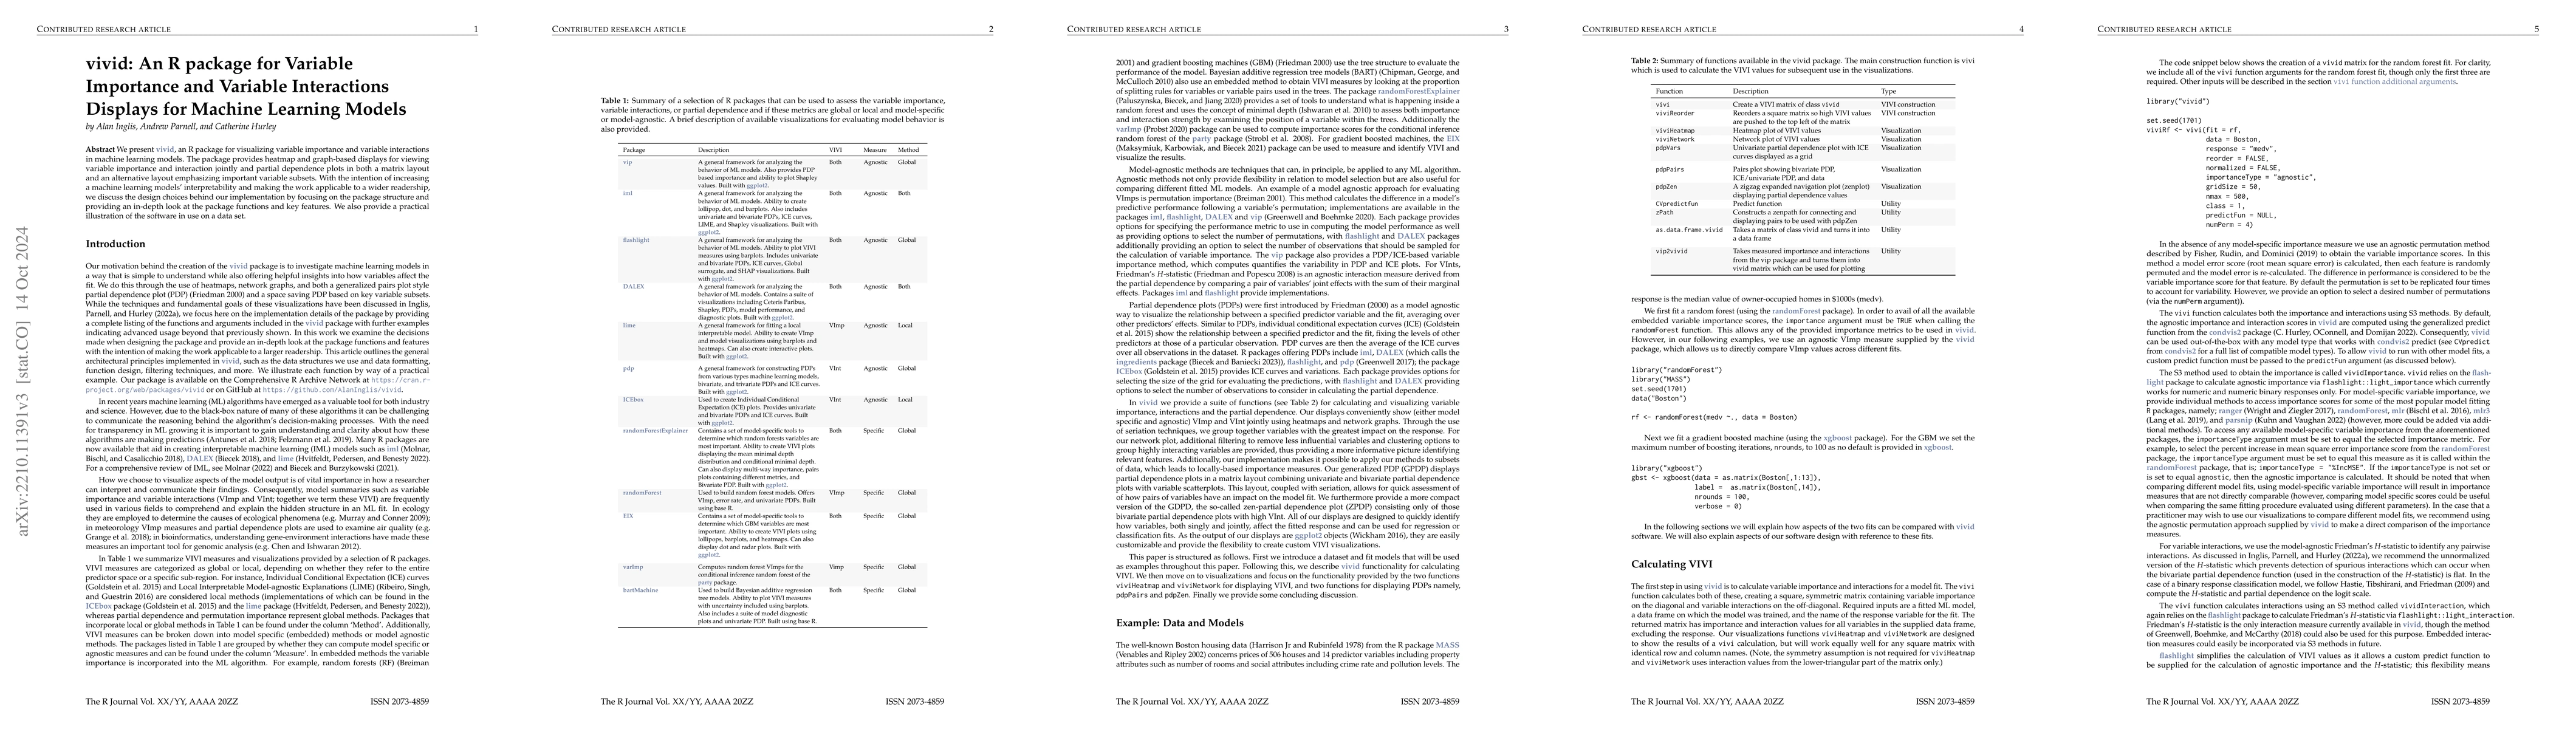
We present vivid, an R package for visualizing variable importance and variable interactions in machine learning models. The package provides a range of displays including heatmap and graph-based displays for viewing variable importance and interaction jointly and partial dependence plots in both a matrix layout and an alternative layout emphasizing important variable subsets. With the intention of increasing a machine learning models' interpretability and making the work applicable to a wider readership, we discuss the design choices behind our implementation by focusing on the package structure and providing an in-depth look at the package functions and key features. We also provide a practical illustration of the software in use on a data set.
AI Key Findings
Get AI-generated insights about this paper's methodology, results, significance, and more — seven facets brought into focus.
Impact
Paper Details
Authors
PDF Preview
Key Terms
Citation Network
Current paper (gray), citations (green), references (blue)
Display is limited for performance on very large graphs.
Discussion 0