Visualisation of Brain Statistics with R-packages ggseg and ggseg3d
Publication
Metrics
AI Quick Summary
This paper introduces R-packages ggseg and ggseg3d for visualizing brain segmentations in 2D and 3D, respectively, enhancing the spatial representation of neuroimaging data. These packages integrate with other R tools, offering flexible and intuitive visualizations for brain atlases.
Paper Preview
Abstract
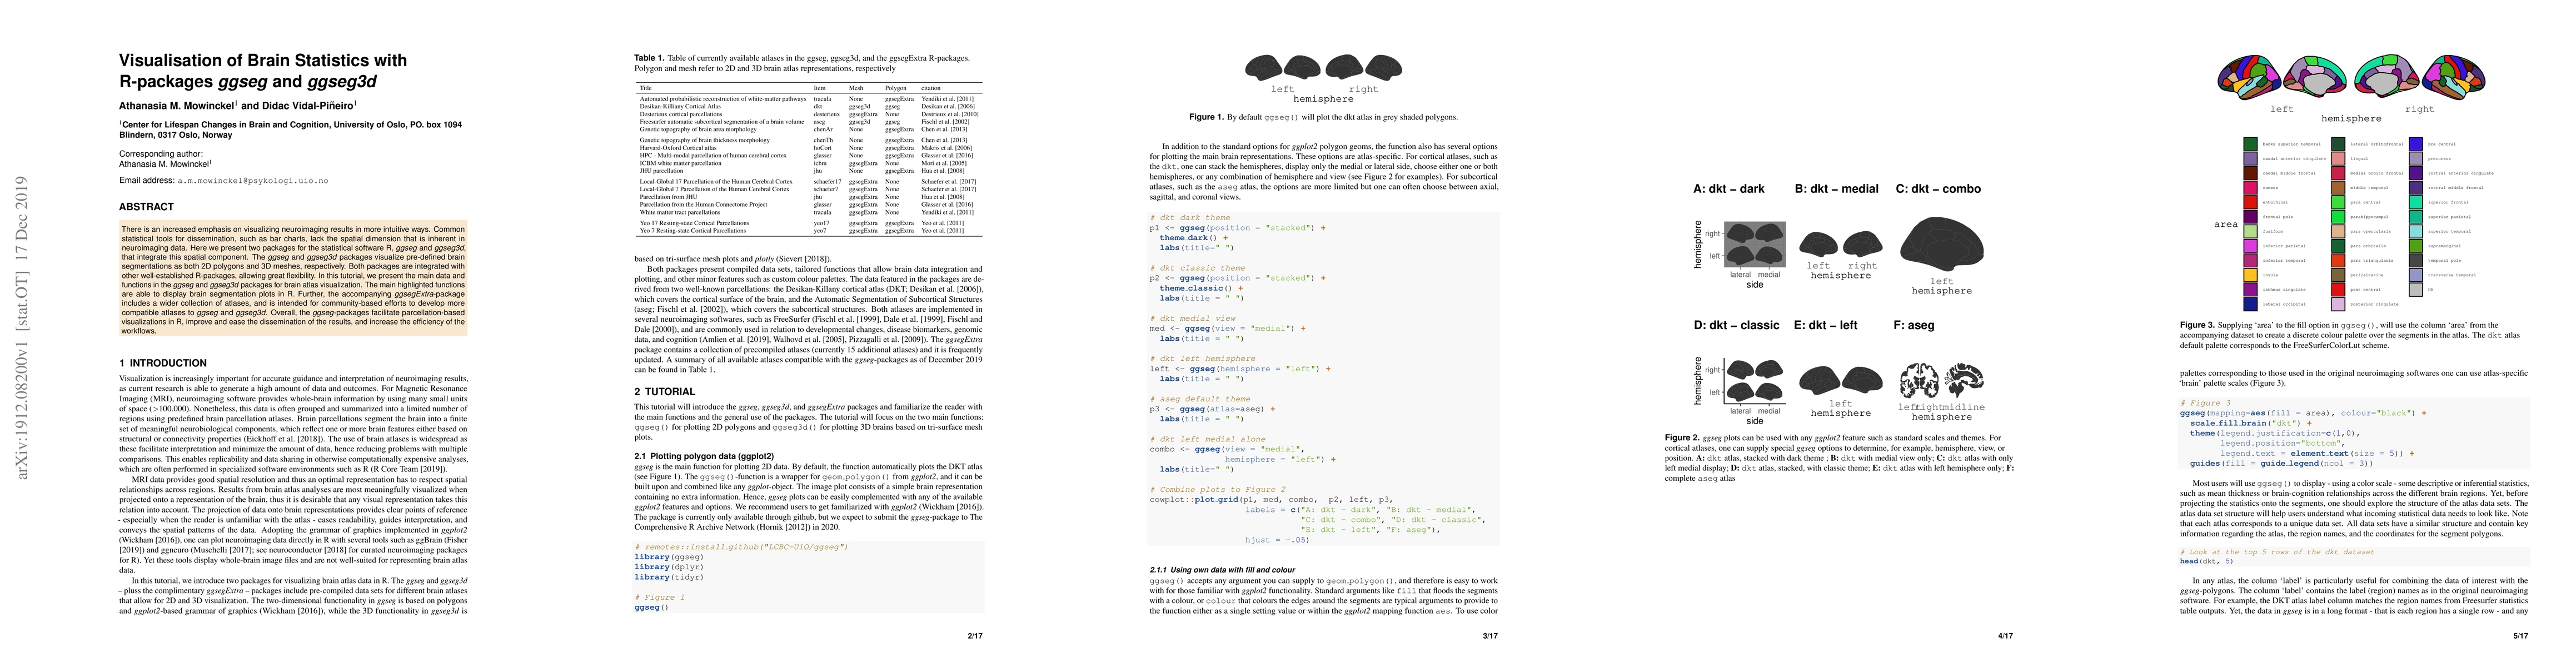
There is an increased emphasis on visualizing neuroimaging results in more intuitive ways. Common statistical tools for dissemination, such as bar charts, lack the spatial dimension that is inherent in neuroimaging data. Here we present two packages for the statistical software R, ggseg and ggseg3d, that integrate this spatial component. The ggseg and ggseg3d packages visualize pre-defined brain segmentations as both 2D polygons and 3D meshes, respectively. Both packages are integrated with other well-established R-packages, allowing great flexibility. In this tutorial, we present the main data and functions in the ggseg and ggseg3d packages for brain atlas visualization. The main highlighted functions are able to display brain segmentation plots in R. Further, the accompanying ggsegExtra-package includes a wider collection of atlases, and is intended for community-based efforts to develop more compatible atlases to ggseg and ggseg3d. Overall, the ggseg-packages facilitate parcellation-based visualizations in R, improve and ease the dissemination of the results, and increase the efficiency of the workflows.
AI Key Findings
Get AI-generated insights about this paper's methodology, results, significance, and more — seven facets brought into focus.
Impact
Paper Details
Authors
PDF Preview
Key Terms
Citation Network
Current paper (gray), citations (green), references (blue)
Display is limited for performance on very large graphs.
Discussion 0