Visualisation of financial time series by linear principal component analysis and nonlinear principal component analysis
Publication
Metrics
AI Quick Summary
This paper explores the visualisation of financial time series using linear and nonlinear principal component analysis, aiming to support technical analysis. It compares these methods and demonstrates their effectiveness in distinguishing normal and crisis periods in financial markets.
Paper Preview
Abstract
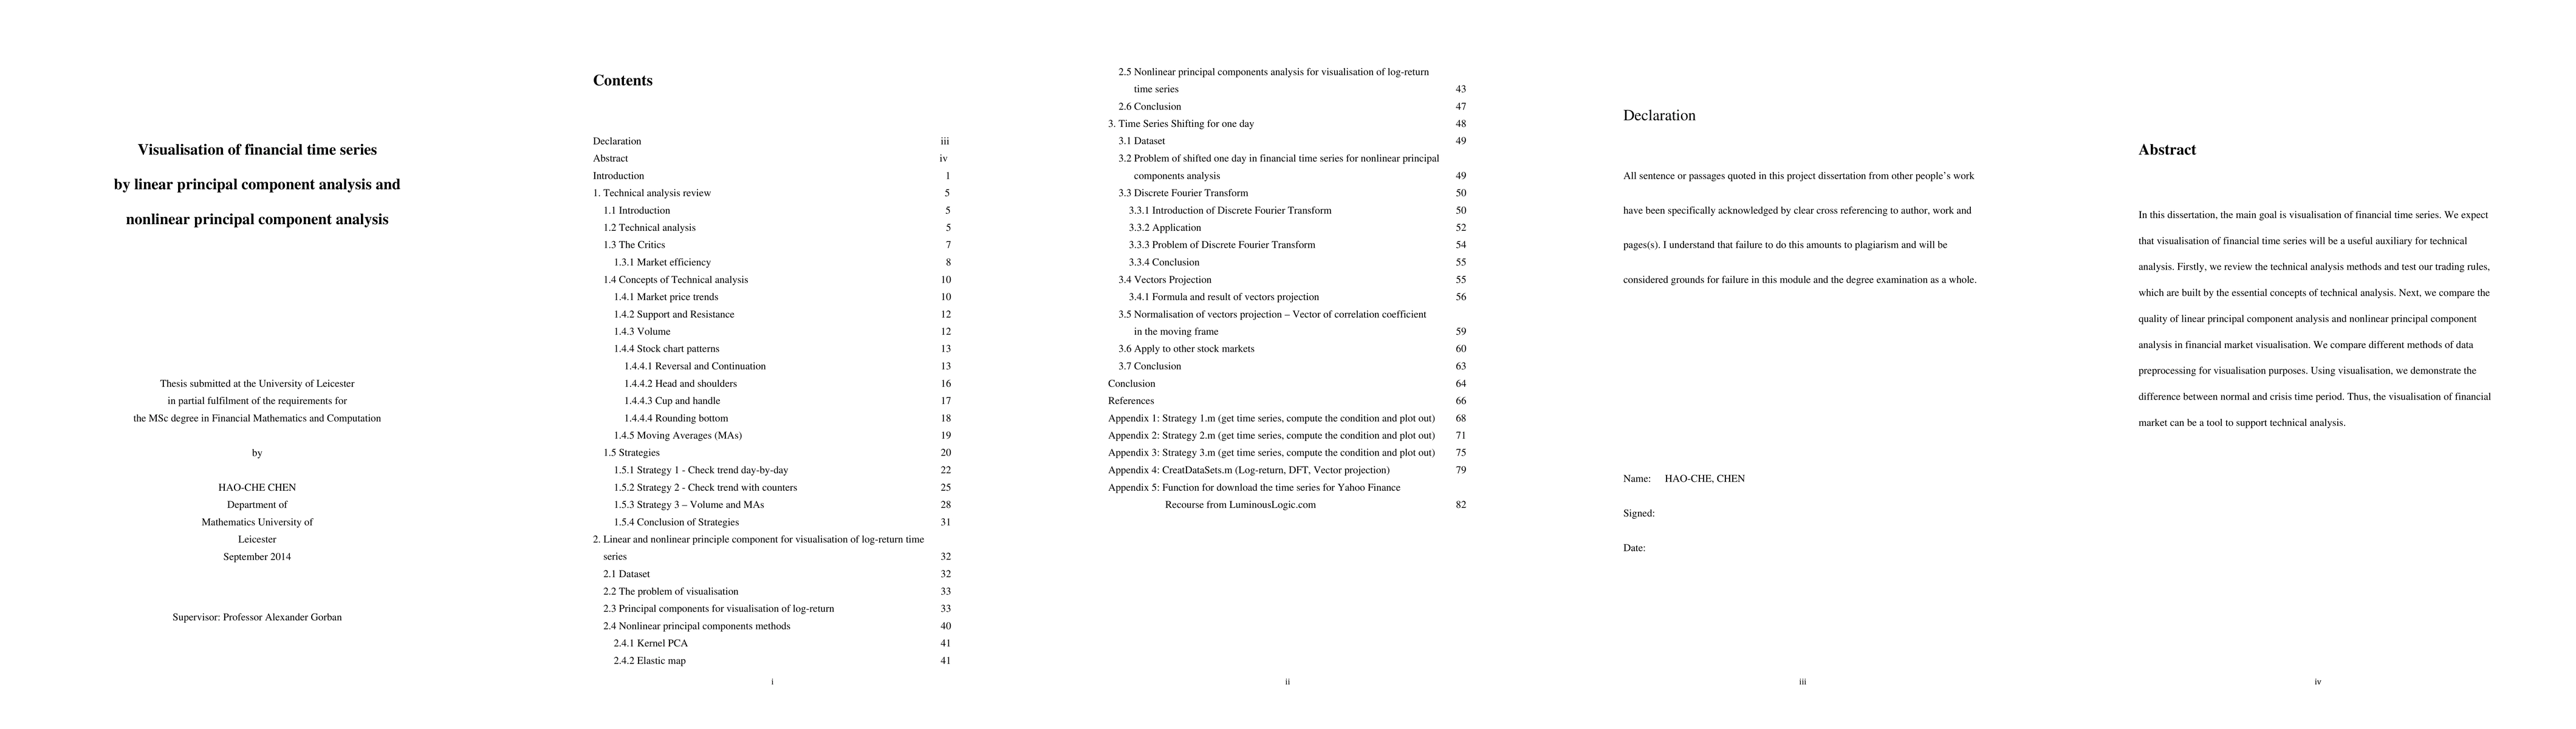
In this dissertation, the main goal is visualisation of financial time series. We expect that visualisation of financial time series will be a useful auxiliary for technical analysis. Firstly, we review the technical analysis methods and test our trading rules, which are built by the essential concepts of technical analysis. Next, we compare the quality of linear principal component analysis and nonlinear principal component analysis in financial market visualisation. We compare different methods of data preprocessing for visualisation purposes. Using visualisation, we demonstrate the difference between normal and crisis time period. Thus, the visualisation of financial market can be a tool to support technical analysis.
AI Key Findings
Get AI-generated insights about this paper's methodology, results, significance, and more — seven facets brought into focus.
Impact
Paper Details
PDF Preview
Key Terms
Citation Network
Current paper (gray), citations (green), references (blue)
Display is limited for performance on very large graphs.
Discussion 0