Visualization for departures from symmetry with the power-divergence-type measure in two-way contingency tables
Publication
Metrics
AI Quick Summary
This paper introduces a novel correspondence analysis method using a power-divergence-type measure to visualize departures from symmetry in square contingency tables. The proposed approach ensures equal contribution rates for the principal axes and scaling independent of sample size, enabling accurate comparisons across multiple tables.
Paper Preview
Abstract
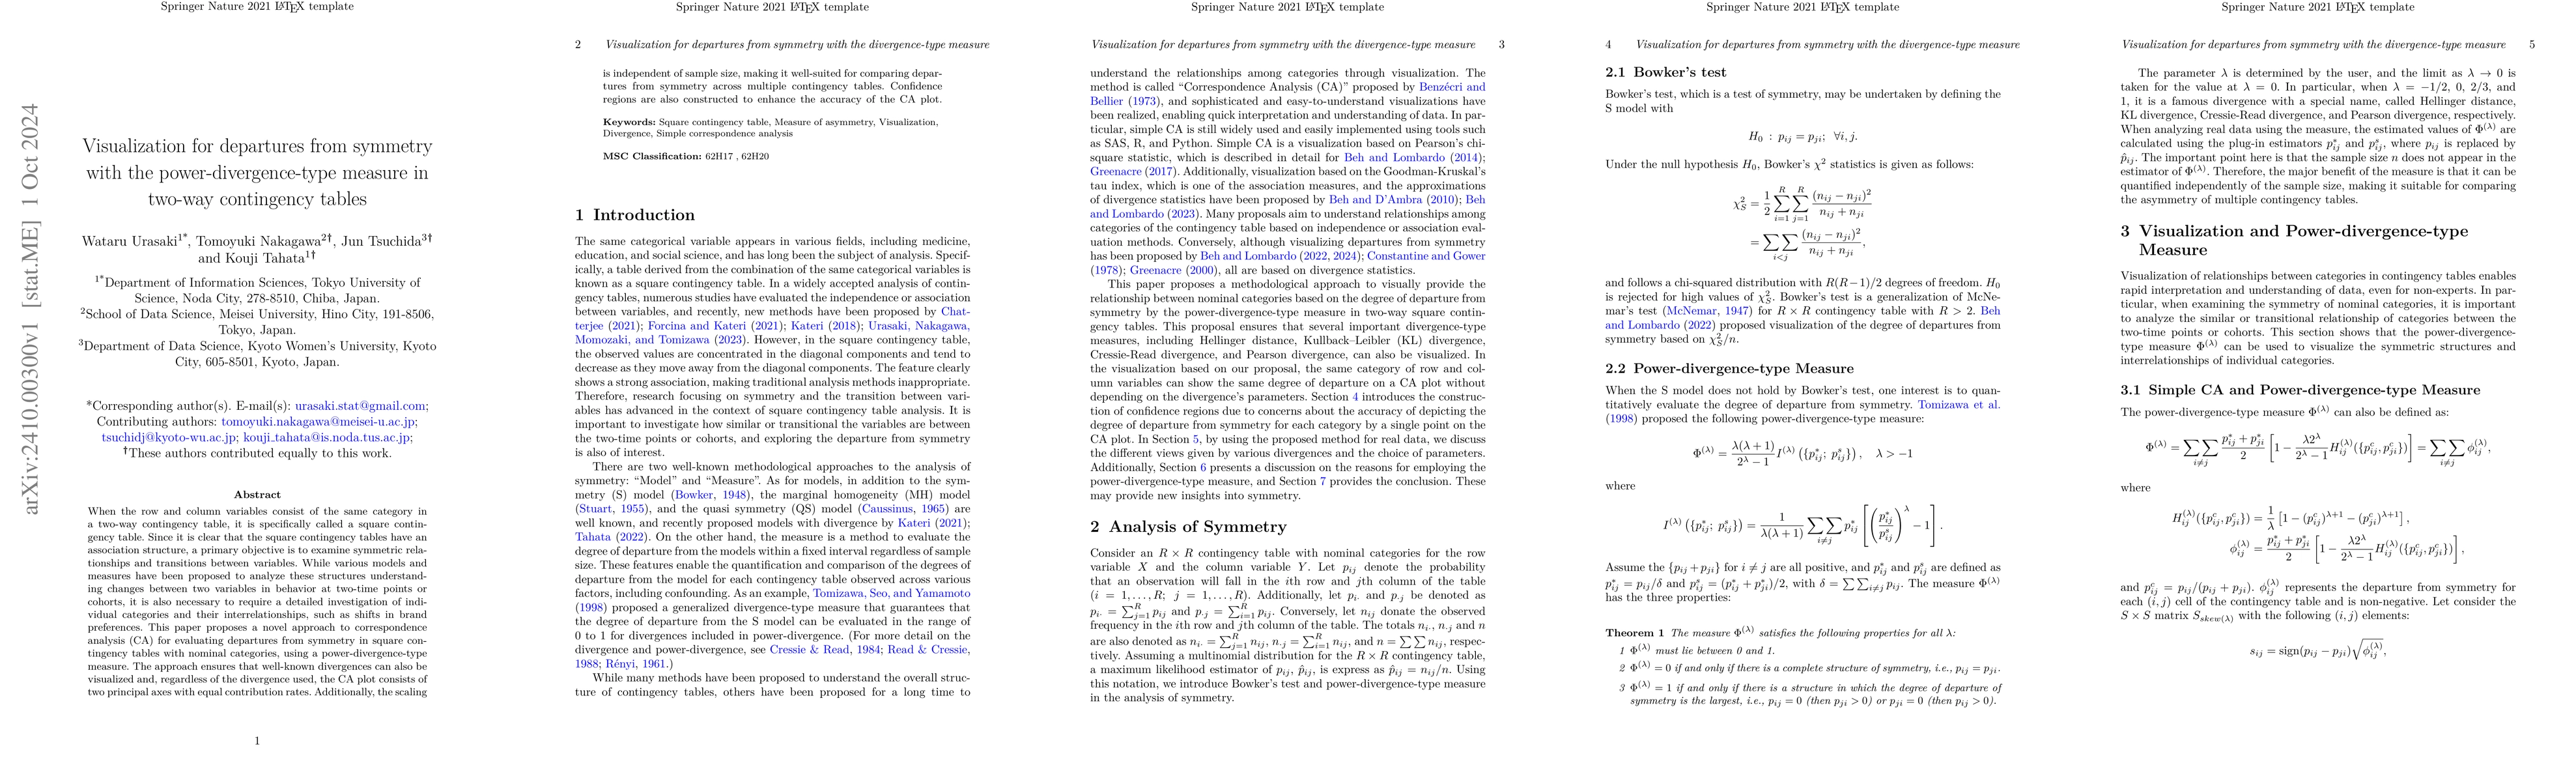
When the row and column variables consist of the same category in a two-way contingency table, it is specifically called a square contingency table. Since it is clear that the square contingency tables have an association structure, a primary objective is to examine symmetric relationships and transitions between variables. While various models and measures have been proposed to analyze these structures understanding changes between two variables in behavior at two-time points or cohorts, it is also necessary to require a detailed investigation of individual categories and their interrelationships, such as shifts in brand preferences. This paper proposes a novel approach to correspondence analysis (CA) for evaluating departures from symmetry in square contingency tables with nominal categories, using a power-divergence-type measure. The approach ensures that well-known divergences can also be visualized and, regardless of the divergence used, the CA plot consists of two principal axes with equal contribution rates. Additionally, the scaling is independent of sample size, making it well-suited for comparing departures from symmetry across multiple contingency tables. Confidence regions are also constructed to enhance the accuracy of the CA plot.
AI Key Findings
Get AI-generated insights about this paper's methodology, results, significance, and more — seven facets brought into focus.
Impact
Authors
PDF Preview
Citation Network
Current paper (gray), citations (green), references (blue)
Display is limited for performance on very large graphs.
Discussion 0