Visualizing departures from marginal homogeneity for square contingency tables with ordered categories
Publication
Metrics
AI Quick Summary
This paper introduces a new visualization technique to intuitively depict departures from marginal homogeneity in square contingency tables with ordered categories, using the Matusita distance. It proposes sub-measures of categorical data to enhance the interpretability of the analysis, demonstrating its effectiveness through multiple examples.
Paper Preview
Abstract
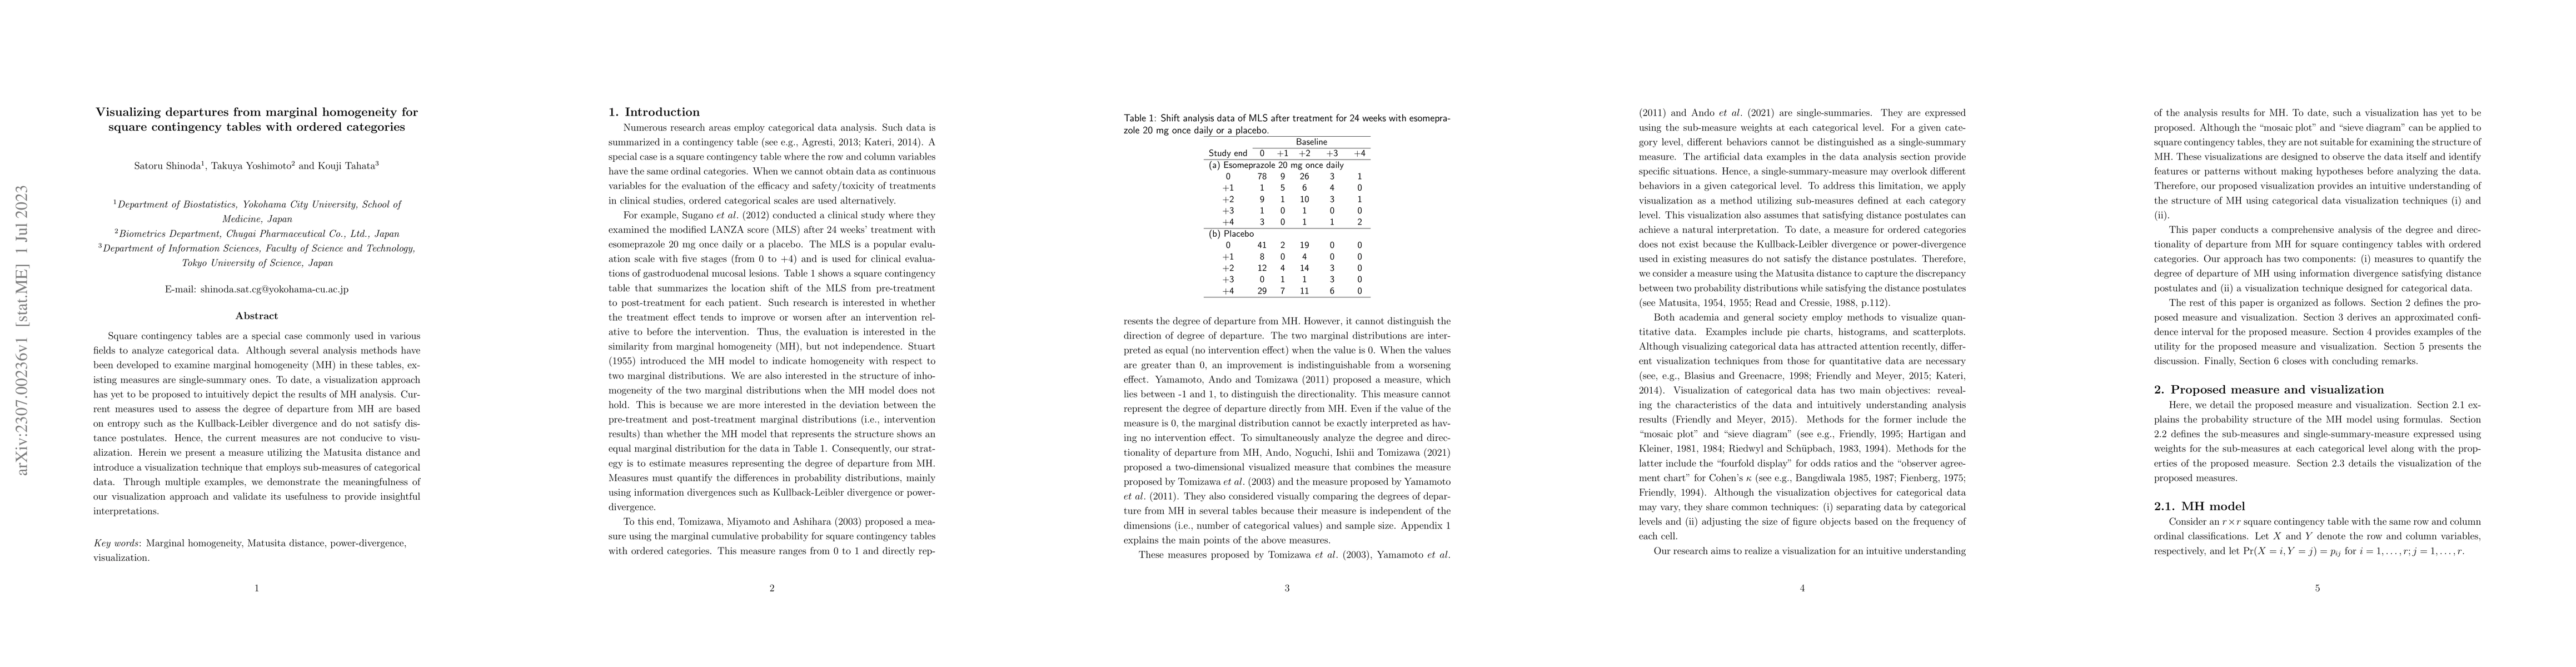
Square contingency tables are a special case commonly used in various fields to analyze categorical data. Although several analysis methods have been developed to examine marginal homogeneity (MH) in these tables, existing measures are single-summary ones. To date, a visualization approach has yet to be proposed to intuitively depict the results of MH analysis. Current measures used to assess the degree of departure from MH are based on entropy such as the Kullback-Leibler divergence and do not satisfy distance postulates. Hence, the current measures are not conducive to visualization. Herein we present a measure utilizing the Matusita distance and introduce a visualization technique that employs sub-measures of categorical data. Through multiple examples, we demonstrate the meaningfulness of our visualization approach and validate its usefulness to provide insightful interpretations.
AI Key Findings
Get AI-generated insights about this paper's methodology, results, significance, and more — seven facets brought into focus.
Impact
Paper Details
Authors
PDF Preview
Key Terms
Citation Network
Current paper (gray), citations (green), references (blue)
Display is limited for performance on very large graphs.
Discussion 0