Publication
Metrics
AI Quick Summary
This paper discusses the importance of visualization beyond trace plots in Bayesian workflow, emphasizing its role in iterative model building, inference, checking, evaluation, and expansion, especially for high-dimensional models. Visualization aids in drawing accurate inferences in modern Bayesian data analysis.
Paper Preview
Abstract
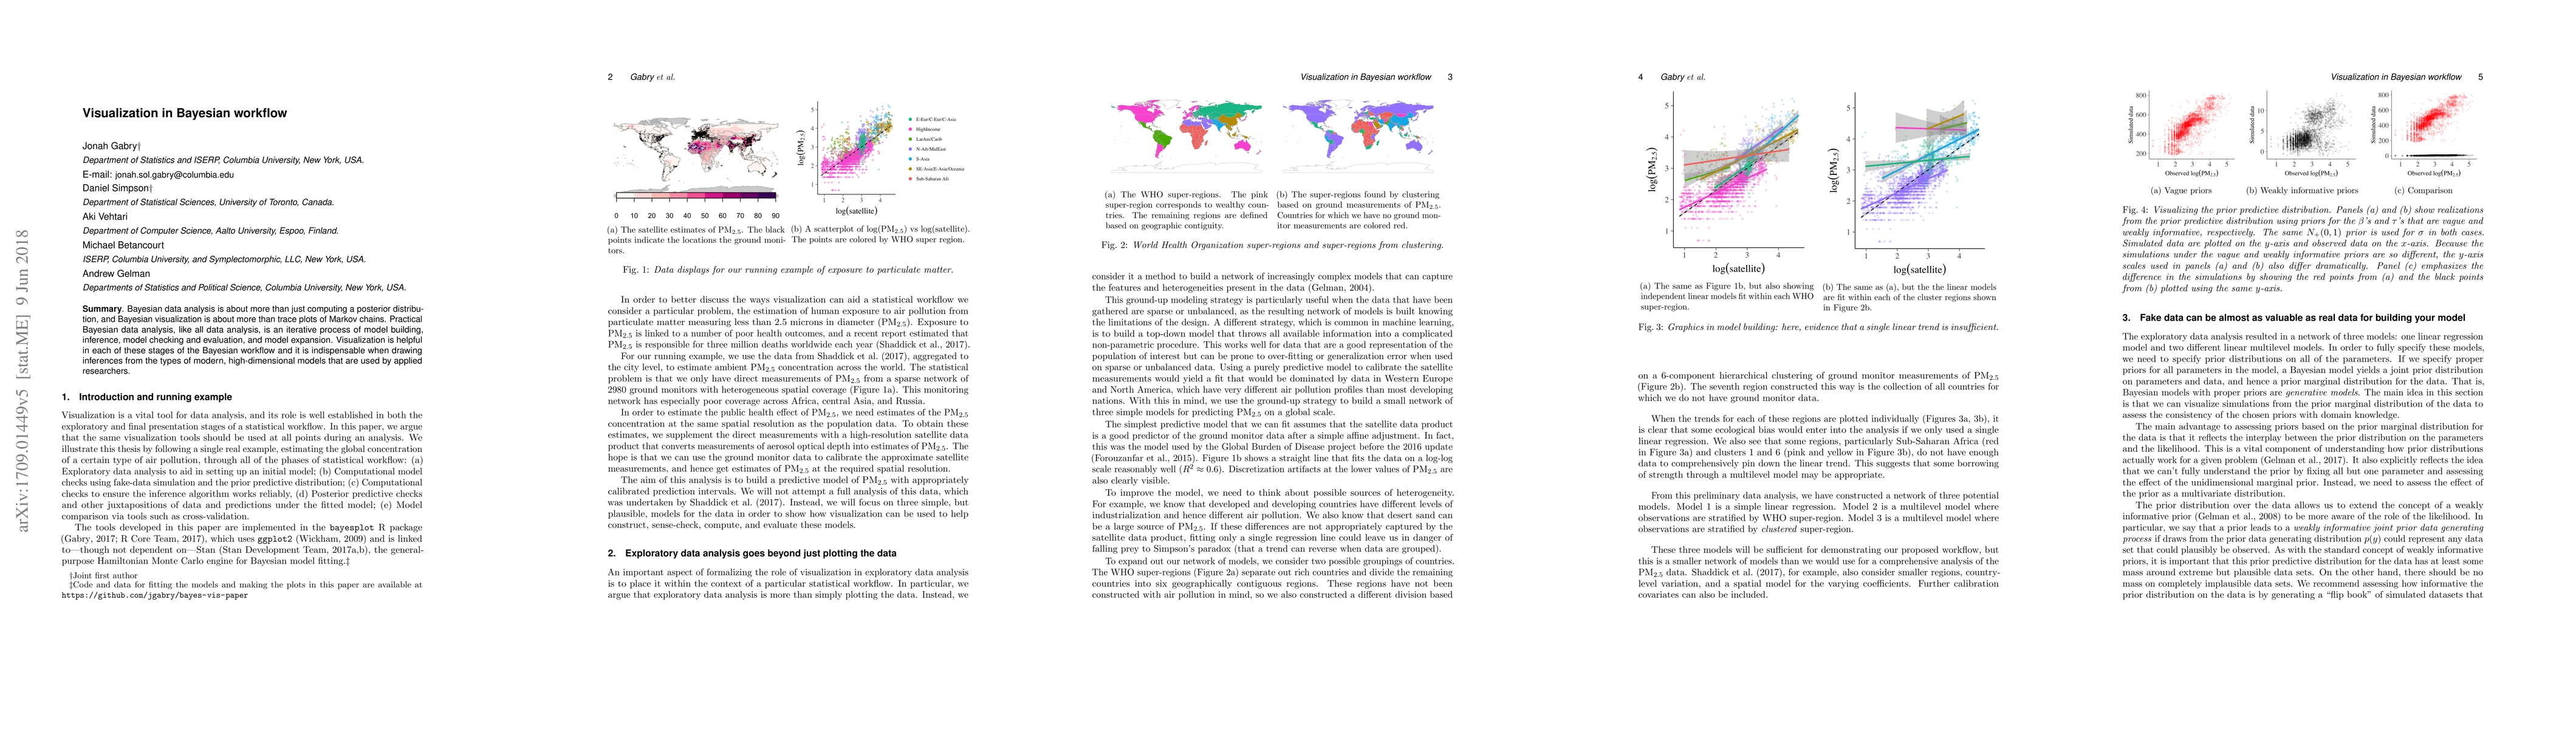
Bayesian data analysis is about more than just computing a posterior distribution, and Bayesian visualization is about more than trace plots of Markov chains. Practical Bayesian data analysis, like all data analysis, is an iterative process of model building, inference, model checking and evaluation, and model expansion. Visualization is helpful in each of these stages of the Bayesian workflow and it is indispensable when drawing inferences from the types of modern, high-dimensional models that are used by applied researchers.
AI Key Findings
Get AI-generated insights about this paper's methodology, results, significance, and more — seven facets brought into focus.
Impact
Paper Details
PDF Preview
Key Terms
Citation Network
Current paper (gray), citations (green), references (blue)
Display is limited for performance on very large graphs.
Discussion 0