Visualizing and comparing distributions with half-disk density strips
Publication
Metrics
Paper Preview
Abstract
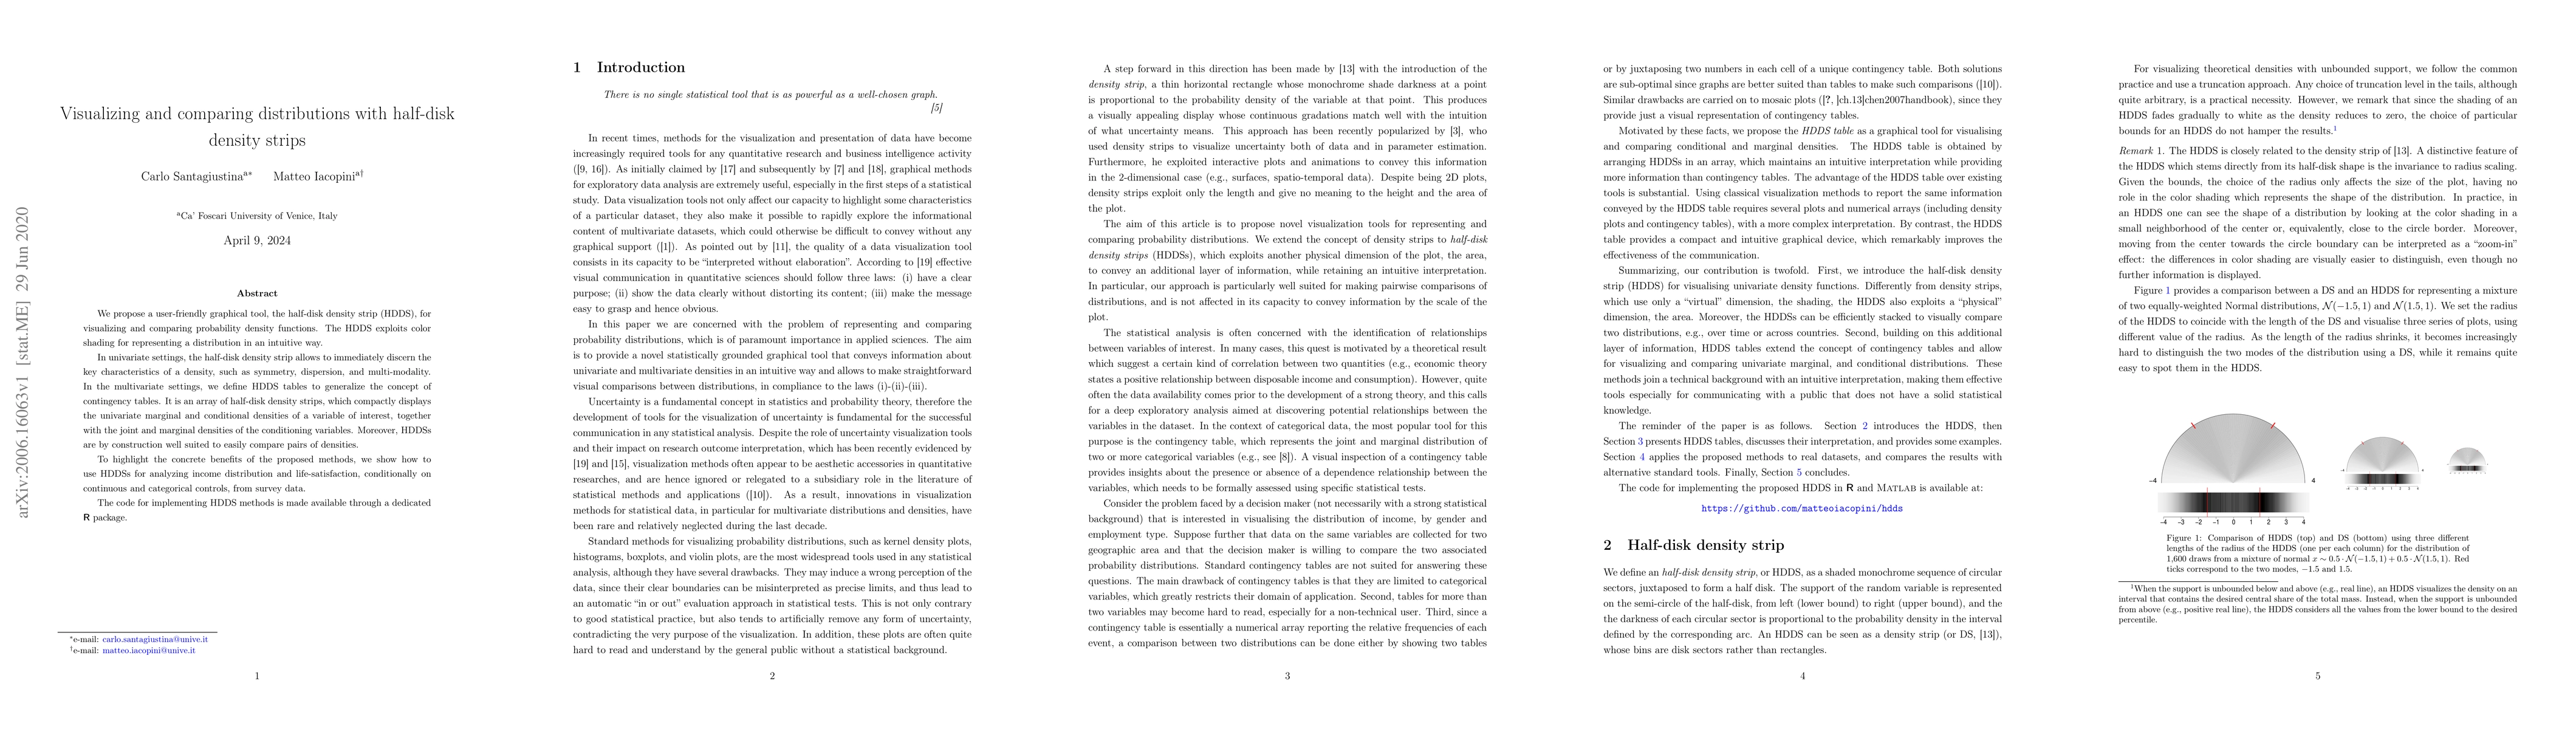
We propose a user-friendly graphical tool, the half-disk density strip (HDDS), for visualizing and comparing probability density functions. The HDDS exploits color shading for representing a distribution in an intuitive way. In univariate settings, the half-disk density strip allows to immediately discern the key characteristics of a density, such as symmetry, dispersion, and multi-modality. In the multivariate settings, we define HDDS tables to generalize the concept of contingency tables. It is an array of half-disk density strips, which compactly displays the univariate marginal and conditional densities of a variable of interest, together with the joint and marginal densities of the conditioning variables. Moreover, HDDSs are by construction well suited to easily compare pairs of densities. To highlight the concrete benefits of the proposed methods, we show how to use HDDSs for analyzing income distribution and life-satisfaction, conditionally on continuous and categorical controls, from survey data. The code for implementing HDDS methods is made available through a dedicated R package.
AI Key Findings
Get AI-generated insights about this paper's methodology, results, significance, and more — seven facets brought into focus.
Impact
Paper Details
Authors
PDF Preview
Key Terms
Citation Network
Current paper (gray), citations (green), references (blue)
Display is limited for performance on very large graphs.
Discussion 0