Publication
Metrics
AI Quick Summary
The paper introduces GTSNE, a novel method for visualizing high-dimensional data in 2D, outperforming t-SNE and UMAP in preserving both local and macro structures across various datasets.
Paper Preview
Abstract
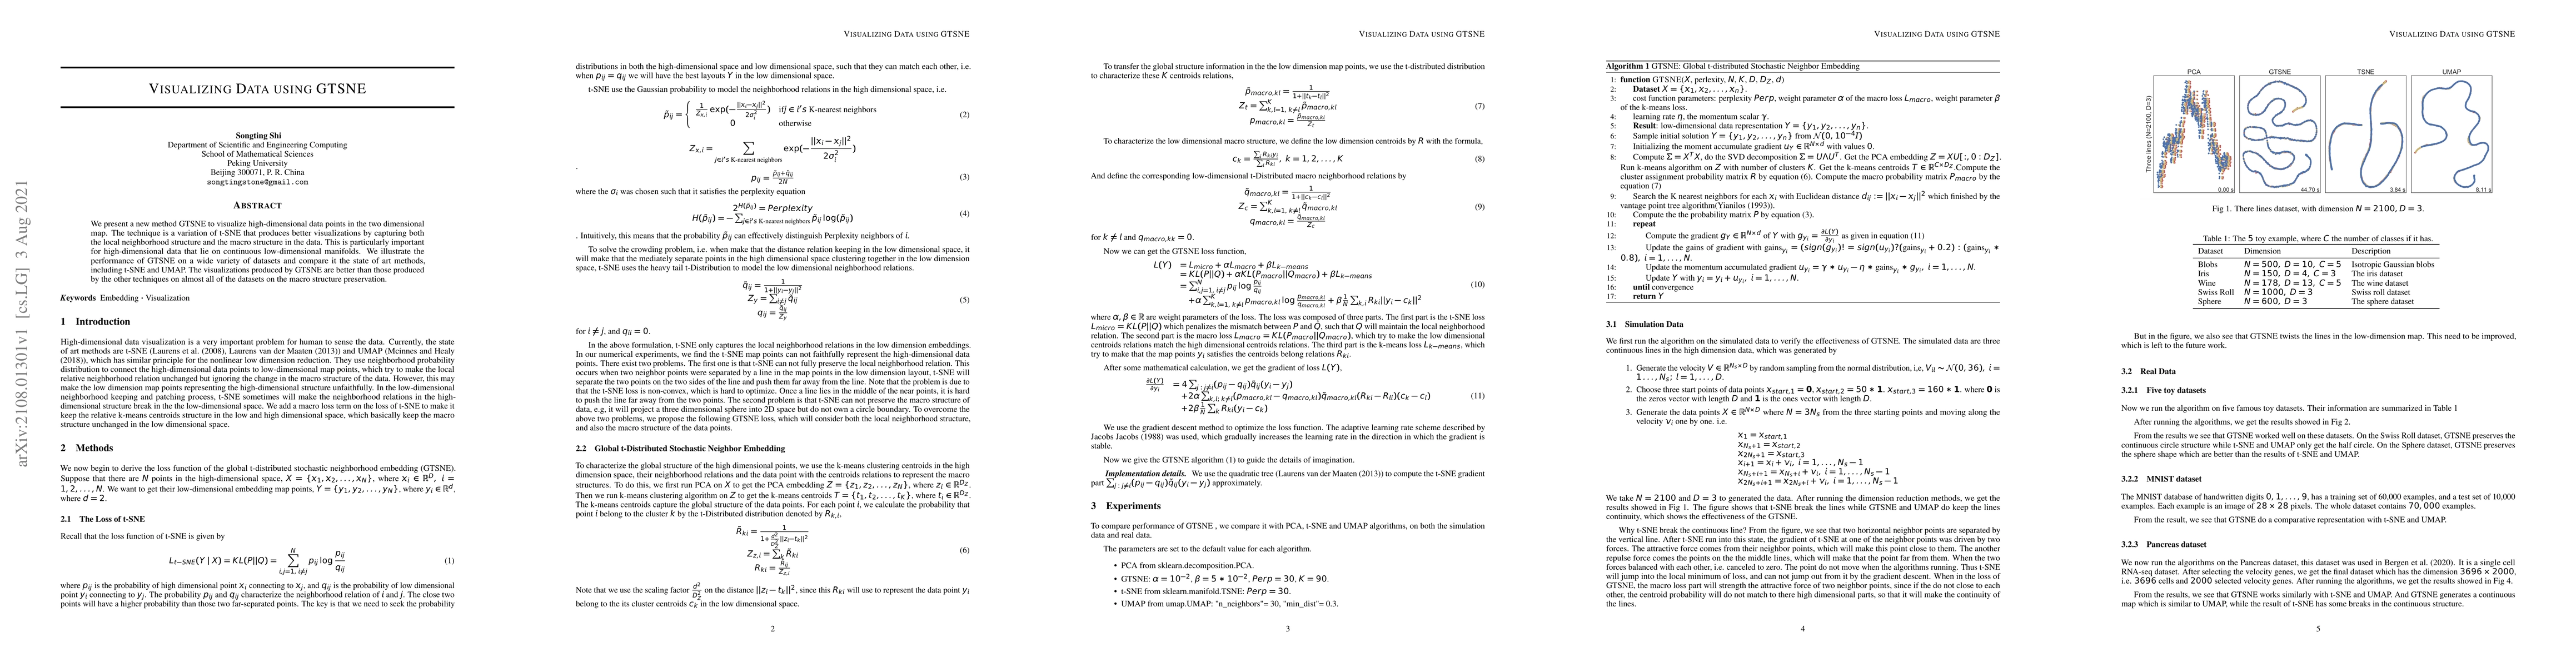
We present a new method GTSNE to visualize high-dimensional data points in the two dimensional map. The technique is a variation of t-SNE that produces better visualizations by capturing both the local neighborhood structure and the macro structure in the data. This is particularly important for high-dimensional data that lie on continuous low-dimensional manifolds. We illustrate the performance of GTSNE on a wide variety of datasets and compare it the state of art methods, including t-SNE and UMAP. The visualizations produced by GTSNE are better than those produced by the other techniques on almost all of the datasets on the macro structure preservation.
AI Key Findings
Get AI-generated insights about this paper's methodology, results, significance, and more — seven facets brought into focus.
Impact
Paper Details
Authors
PDF Preview
Key Terms
Citation Network
Current paper (gray), citations (green), references (blue)
Display is limited for performance on very large graphs.
Discussion 0